SearchUser loginOffice of CitizenRest in Peace,
Who's new
Subscribe |
Assessment of Power Plants That Meet Proposed Greenhouse Gas Emission Performance Standards - Final Report - 4/22/2010Submitted by Norm Roulet on Fri, 06/04/2010 - 07:00.
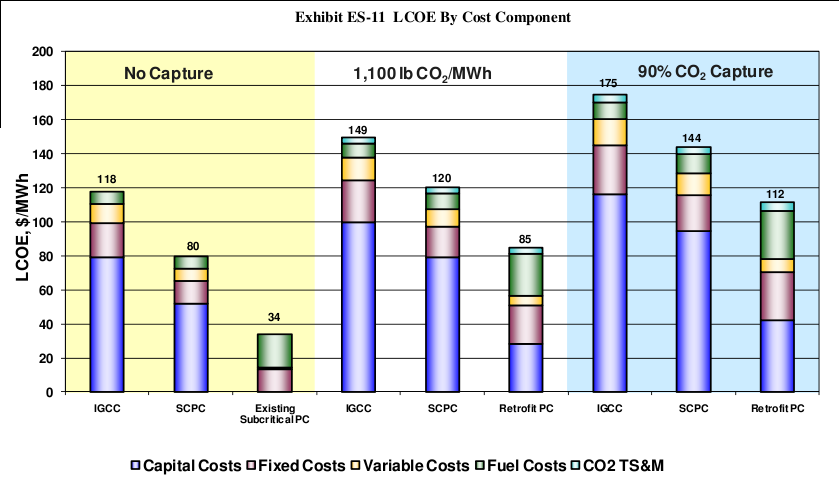
The chart above presents some of the most important data in the world for citizens to understand about the future physical and economic health and well being of all people on Earth, and for all life on Earth - the Total Levelized Costs of Electricity including TS&M shown in Exhibit ES-11 is the cost breakdown from the ASSESSMENT OF POWER PLANTS THAT MEET PROPOSED GREENHOUSE GAS EMISSION PERFORMANCE STANDARDS - November 5, 2009 - REVISED 4/22/2010 that demonstrates that all the technologies available and in immediate development to burn coal to generate utility scale power at the emissions standards set for California are more expensive than generating electricity by wind - significantly more expensive. Solar has better economic value than coal as well. The National Renewable Energy Laboratory (NREL) just conducted a comparison of the relative impacts of various financial, technological, and wind resource variables on the LCOE from utility-scale wind projects and found a base case range of $54-74/MWh.
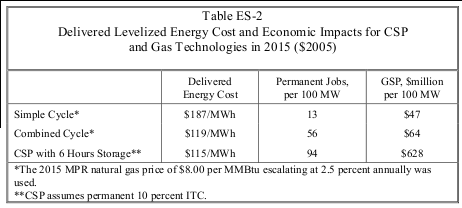
The National Renewable Energy Laboratory (NREL) also conducted a 2006 study "Economic, Energy, and Environmental Benefits of Concentrating Solar Power in California" which found the LCOE for utility-scale solar energy production will be around $115 by 2015 (it is not much higher today), making it less expensive than natural gas technologies anticipated to be available in this time frame - and this study determined additional benefits: "In terms of economic return, for each 100 MW of installed capacity, the CSP plant was estimated to create about $628 million in impact to gross state output compared to an impact of about $64 million for the combined cycle plant and $47 million for the simple cycle plant." Much of the benefit is that more local jobs are created installing and operating solar - jobs are good!
As illustrated at the top of this post, and throughout the report below, building a greenfield supercritical pulverized coal plant without carbon capture starts at LCOE $80/MWh, and increases 50% to $120 with carbon capture and sequestration to the 1,000 lb/MWh level... increases another $24/Mwh to LCOE $144 to meet the 90% factor. The greenest coal dream of all, gasification, starts at LCOE of $118/MWh without carbon capture and rises to $149/MWh at the 1,000lb standard... $175/MWh for the 90% standard. Compare any and all of those costs to what we pay on balance today to generate electricity from dirty coal plants... $34/WMh... and realize how far up costs must go to addess our environmental crisis in this region for just this one component of our pollution... CO2 management from coal burning utility power plants in the region. In places that depend on coal for their power generation, like in Ohio - where over 90% of electricity consumed here is generated by burning coal dirty - where inadequate effort has been made to develop utility-scale alternative energy solutions and to reduce CO2 and other emissions from existing coal power plants, electricity consumers must expect significant increases in utility costs. Ohio must clean-up excessively-polluting coal-burning point sources to meet new Federal and global environmental requirements - know cleaning up from our coal legacy will cost citizens here $billions, and make Ohio a high-cost energy state. From a global perspective, America and developing nations have pinned their economic futures on cheap energy from cheap coal that is not renewable and not cheaply clean... never really clean... meaning economic development in America and developing nations will be stalled by energy and environmental crises - these nations include India and China, where a new dirty coal plant goes on-line weekly, on average. That is not sustainable, and clean coal is not an alternative. Consider insightful perspectives on this concern from the recent New York Times editorial "Coal Sans CO2: Appealing Pipe Dream": The issue isn’t technology or geology (finding safe storage sites for huge volumes) nearly so much as cost. And remember, this isn’t about the affordability of the technology in the United States or Europe. It’s about the cost of deployment at large scale in the coal-boom countries, China and India. Where the NYTimes is wrong is that this is about the affordability of the technology in the United States because we certainly cannot afford clean coal in Ohio. Nor can we afford to address pollution from coal burning and other pollution issues at Mittal and other industrial sites across the state, which operate with different regulations. The timely, excellent, exhaustive Department of Energy study below of the reality of coal energy costs now and in the future confirms highly-polluting electric power generated by existing subcritical pulverized coal plants without CO2 capture and sequestration is cheap - LCOE of $34/MWh - and it finds that adding the cost to retrofit these existing plants to meet California emissions standards of 1,000 lbs of CO2/MWh more than doubles LCOE to $85/MWh... reducing emissions to a lower standard of 90% of current emissions brings LCOE over 3X costs without carbon capture, at $112/MWh. And that is about as cheap as coal shall ever be or get... and the new cleaner coal burning technologies are much higher cost than that. With this data from the Department of Energy, you are just beginning to see the fire ignite on a burning platform for this region more dangerous than Deepwater... I've included below the text and related exhibits for the entire executive summary and conclusion from this 326 page .PDF, to make them more user-friendly and readable - read below about Ohio's great black hope that is hopeless... a FutureGen economy with no future... and reflect on how on Earth Ohioans will dig ourselves out of the mess our leaders dug us into digging for the clean in coal that is not and never will be.
ASSESSMENT OF POWER PLANTS THAT MEET PROPOSED GREENHOUSE GAS EMISSION PERFORMANCE STANDARDS EXECUTIVE SUMMARY Greenhouse gas (GHG) emissions continue to receive increased scrutiny because of their perceived relation to global warming. Numerous bills have been introduced in both the United States Senate and House of Representatives that would limit GHG emissions. The bills vary primarily in the economy sectors regulated, the extent of GHG reductions and the compliance year, but all represent reductions from the “business-as-usual” scenario. In June, 2009 the House of Representatives passed the American Clean Energy and Security Act of 2009 (H.R. 2454) which would limit GHG emissions starting as soon as 2012. The Senate has not yet acted on the House bill or any companion bill, but deliberations are ongoing. Adding to the legislative momentum for carbon regulation, in September, 2009 the Environmental Protection Agency proposed a rule that would limit future regulation of GHG emissions under the Clean Air Act to industrial facilities that emit 25,000 tons or more of carbon dioxide annually. The proposed rule would impact facilities such as power plants, refineries, and factories, which produce nearly 70 percent of domestic GHGs. In addition to proposed Federal regulations, various states have proposed or enacted legislation to reduce GHG emissions. The most imminent regulations were enacted by the state of California and would limit GHG emissions from in-state energy producers or out-of-state producers supplying electricity to California to 1,100 lb CO2/net-MWh [1]. A sampling of the legislation is provided in Section 1.1. The objective of this report is to present the baseline cost and performance of greenfield integrated gasification combined cycle (IGCC) plants, greenfield supercritical (SC) pulverized coal (PC) plants, and retrofit subcritical PC plants that limit carbon dioxide (CO2) emissions to the California standard of 1,100 lb CO2/net-MWh and that achieve 90 percent CO2 capture. For each plant type, three cases were modeled:
The subcritical PC retrofit case was based on a generic plant site, but is representative of a western plant that could supply electricity to California and hence have to meet the 1,100 lb CO2/net-MWh standard. The elevation used was 6,700 ft, which is the average elevation of Wyoming. For consistency between cases, this same elevation was used for all technologies. The fuel used in all nine cases was representative of a coal from the Powder River Basin (PRB) and has the same composition as the subbituminous coal used in an as yet unpublished NETL study entitled “Cost and Performance Baseline for Low-Rank Coal Fossil Energy Plants.” The nine cases are summarized in Exhibit 1-1. The cost and performance of the various fossil fuel-based technologies will most likely determine which combination of technologies will be utilized to meet the demands of the power market. Selection of new generation technologies will depend on many factors, including:
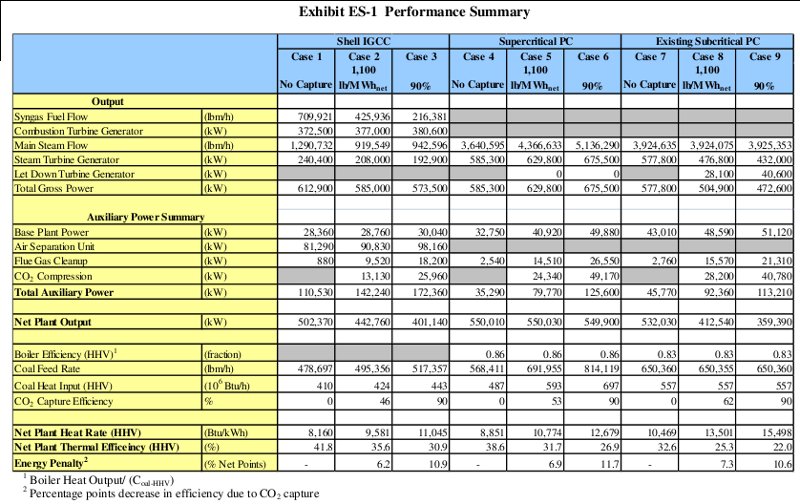
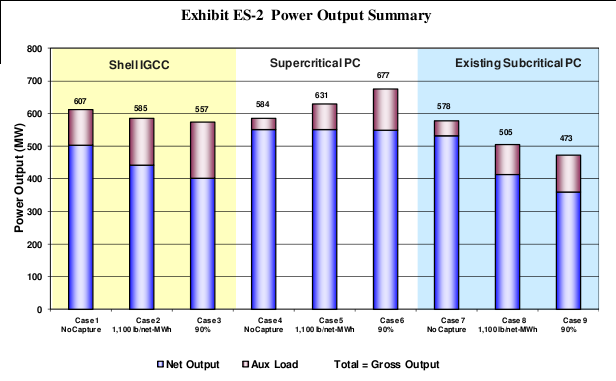
Nine power plant configurations were analyzed as listed in Exhibit 1-1. The list includes three IGCC cases utilizing Shell gasifiers each with and without CO2 capture; six PC cases, three greenfield supercritical and three existing subcritical plants, each with and without CO2 capture. The methodology used information provided by the technology vendors (IGCC) and conventional models and existing plant information (PC) to perform steady-state simulations of the technology using the Aspen Plus (Aspen) modeling program. The resulting mass and energy balance results from the Aspen model were used to size major pieces of equipment. These equipment sizes formed the basis for cost estimating. Costs were scaled from estimates provided previously on similar technologies using PRB coal. The original estimates were developed through a combination of vendor quotes and scaled estimates from previous design/build projects. Performance and process limits were based upon published reports, information obtained from vendors and users of the technology, and cost and performance data from design/build utility projects. Baseline fuel costs for this analysis were determined using data from the Energy Information Administration’s (EIA) Annual Energy Outlook (AEO) 2007. The first year (2015) cost used is $0.57/GJ ($0.61/MMBtu) for coal (Montana Rosebud Powder River Basin) on a higher heating value (HHV) basis and in 2007 U.S. dollars. All plant configurations were evaluated based on installation at a greenfield site, with the exception of the existing subcritical PC plant. Typically, greenfield plants are state-of-the-art plants with higher efficiencies than the existing average power plant population. Consequently, these plants would be expected to be near the top of the dispatch list, and the study capacity factor is chosen to reflect the maximum availability demonstrated for the specific plant type, i.e. 80 percent for IGCC and 85 percent for PC. A capacity factor of 85 percent was also used for the subcritical PC case to be consistent with the SC PC greenfield plant. PERFORMANCE - Plant Output The performance results are presented in Exhibit ES-1 and Exhibit ES-2. The net power output varies between technologies because the combustion turbines in the IGCC cases are manufactured in discrete sizes, but the boilers and steam turbines in the greenfield PC cases are readily available in a wide range of capacities. The net output in the subcritical retrofit PC plant is limited by the capacity of the existing boiler and steam turbine. The result is that all of the greenfield supercritical PC cases have a net output of 550 MW, the subcritical retrofit cases have net outputs ranging from 532 to 359 MW, and the IGCC cases have net outputs ranging from 502 to 401 MW. The range in IGCC net output is caused by the increased elevation, the much higher auxiliary load imposed in the CO2 capture cases primarily due to CO2 compression, and the need for extraction steam in the water-gas shift reactions, which reduces steam turbine output. Higher auxiliary load and extraction steam requirements can be accommodated in the greenfield supercritical PC cases (larger boiler and steam turbine) but not in the IGCC or subcritical retrofit PC cases. For the IGCC cases or subcritical retrofit PC cases, it is impossible to maintain a constant net output from the steam cycle given the fixed input (combustion turbine for IGCC and existing boiler capacity for subcritical retrofit cases). In addition, the combustion turbine output increases with increasing capture levels because of the higher flue gas moisture content due to the higher hydrogen content of the syngas, while the mass flow remains relatively the same. Energy Efficiency The definition of Energy Penalty used in this study to evaluate the impact of energy losses due to the addition of CO2 capture controls is the difference in net power plant efficiency expressed in absolute percentage points as shown in the following equation. Energy Penalty = (Net Power Plant Efficiency) no capture – (Net Power Plant Efficiency) with capture The net plant efficiency (HHV basis) for all 9 cases is shown in Exhibit ES-3.
Performance Highlights:
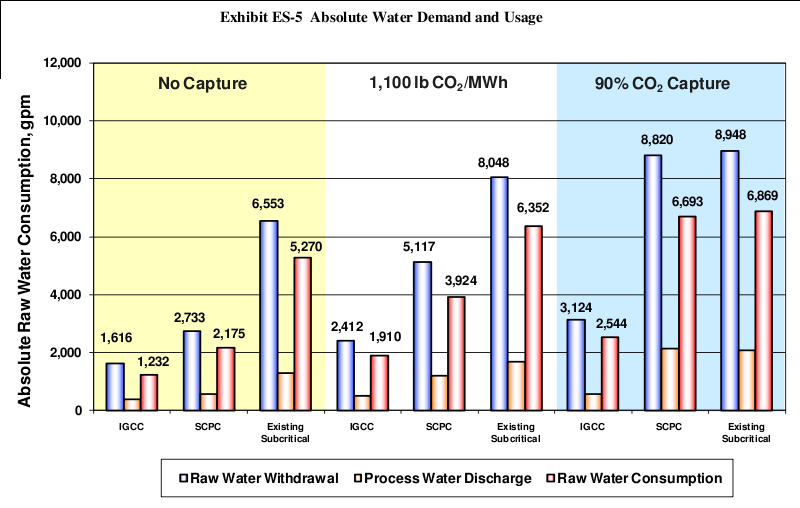
Water Use Three water values are presented for each case in Exhibit ES-4 and Exhibit ES-5: raw water withdrawal, process water discharge and raw water consumption. Each of these values is Exhibit ES-5 shows absolute water withdrawal and consumption. Water demand represents the total amount of water required for a particular process. Some water is recovered within the process, primarily as coal moisture from the drying process and syngas condensate (IGCC cases) or flue gas condensate (PC cases), and that water is re-used as internal recycle. Raw water withdrawal is the difference between water demand and internal recycle. Some water is returned to the source, namely sour water stripper blowdown (IGCC cases) and cooling tower blowdown (IGCC and PC cases). The difference between raw water withdrawal and water returned to the source (process discharge) is raw water consumption, which represents the net impact on the water source. The largest consumer of water in the plant is the makeup to the cooling system. The greenfield plants (IGCC and supercritical PC) use parallel wet (50 percent)/dry (50 percent) cooling. The existing subcritical PC uses only an evaporative cooling tower. The difference in cooling systems has a significant impact on water consumption.
Water Usage Highlights:
COST RESULTS Total Plant Cost The total plant cost (TPC) for each technology was determined through a combination of vendorquotes and scaled estimates from previous design/build projects. For the existing subcritical retrofit PC plant, the cost was determined through the use of a Best Available Retrofit Technology (BART) analysis and scaled estimates. TPC includes all equipment, materials, labor (direct and indirect), engineering and construction management, and contingencies (process and project). Owner’s costs, including preproduction costs, inventory capital, initial cost for catalyst and chemicals, land, financing costs and other owner’s costs were added to TPC to generate total overnight cost (TOC). Property taxes and insurance were included in the fixed operating costs as an additional owner’s cost. TOC was used to calculate the capital component of the levelized cost of electricity (LCOE). A factor was applied to TOC to convert to total as spent cost (TASC), which includes interest and escalation during the construction period. The inclusion of owner’s costs increases the TPC by about 18 percent for each of the cases modeled. The cost estimates carry an accuracy of ±30 percent, consistent with the screening study level of design engineering applied to the various cases in this study. The value of the study lies not in the absolute accuracy of the individual case results but in the fact that all cases were evaluated under the same set of technical and economic assumptions. This consistency of approach allows meaningful comparisons among the cases evaluated. Project contingencies were added to the Engineering/Procurement/Construction Management (EPCM) capital accounts to cover project uncertainty and the cost of any additional equipment that would result from a detailed design. The contingencies represent costs that are expected to occur. Each bare erected cost (BEC) account was evaluated against the level of estimate detail and field experience to determine project contingency. Process contingency was added to cost account items that were deemed to be first-of-a-kind or posed significant risk due to lack of operating experience. The cost accounts that received a process contingency include:
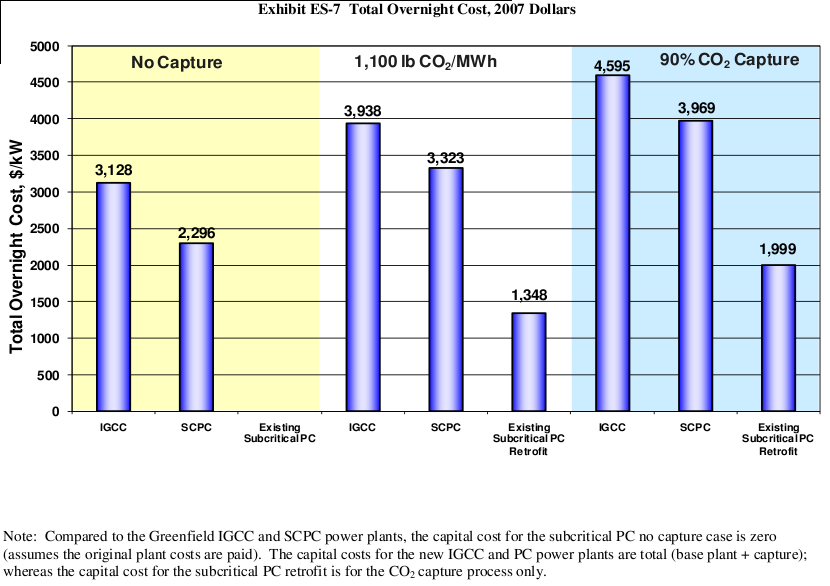
The TPC, TOC and TASC for the nine power plant configurations are shown in Exhibit ES-6 in June 2007 dollars. The normalized TOC for each technology is shown in Exhibit ES-7.
Capital Cost Highlights:
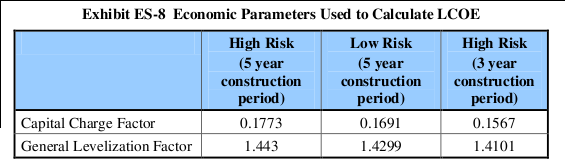
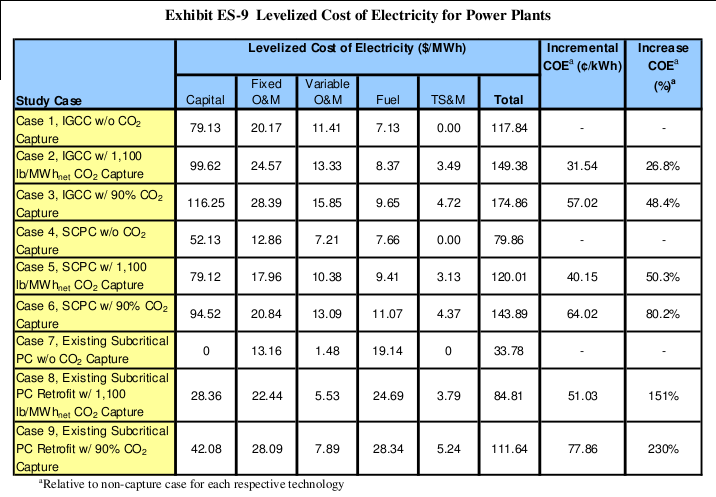
Levelized Cost of Electricity (LCOE) The current dollar, 30-year LCOE was calculated for each case using the economic parameters shown in Exhibit ES-8. The cases were divided into three categories, all undertaken at an investor owned utility: high risk projects with a five year construction duration (all IGCC cases and greenfield SC PC capture cases); low risk projects with a five year construction duration (greenfield SC PC non-capture case); and high risk projects with a three year duration (retrofit PC capture cases). High risk projects are those in which commercial scale operating experience is limited. The IGCC cases (with and without CO2 capture) and the PC cases with CO2 capture were considered to be high risk. The non-capture PC case was considered to be low risk.
The LCOE results are shown in Exhibit ES-9 with the capital cost fixed operating cost, variable operating cost, fuel cost and TS&M cost shown separately. When carbon capture is implemented, the net power output of the subcritical PC plant decreases to 413 MW and 359 MW for the 1,100 lb/net-MWh and 90 percent capture cases, respectively. The current electricity cost for the subcritical PC plant was estimated to be $19/MWh using the Energy Velocity Database. An estimated cost for the plant property taxes and insurance was added to the fixed O&M costs for a total current cost of electricity of $26.29/MWh. The current cost was levelized using the same factor applied to the retrofit cases yielding an LCOE of $33.78/MWh.
LCOE Cost Highlights:
The TS&M in the costs assume the CO2 is transported 50 miles via pipeline to a geological sequestration field, injected into a saline formation at a depth of 4,055 ft and monitored for 30 years during plant life and 50 years following for a total of 80 years. These values are shown in Exhibit ES-10. The Total Levelized Costs of Electricity including TS&M are shown in Exhibit ES-11. Exhibit ES-10 Levelized Cost of Electricity for CO2 Transport, Storage, and Monitoring Exhibit ES-10 Levelized Cost of Electricity for CO2 Transport, Storage, and Monitoring
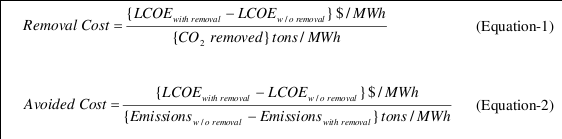
CO2 Mitigation Cost The cost of CO2 capture was calculated in two ways, the cost of CO2 removed and the cost of CO2 avoided, as illustrated in Equations 1 and 2, respectively.
The LCOE with CO2 removal includes the costs of capture and compression as well as TS&M costs. The resulting removal and avoided costs are shown in Exhibit ES-12 for each of the six capture technologies modeled.
CO2 Mitigation Cost Highlights:
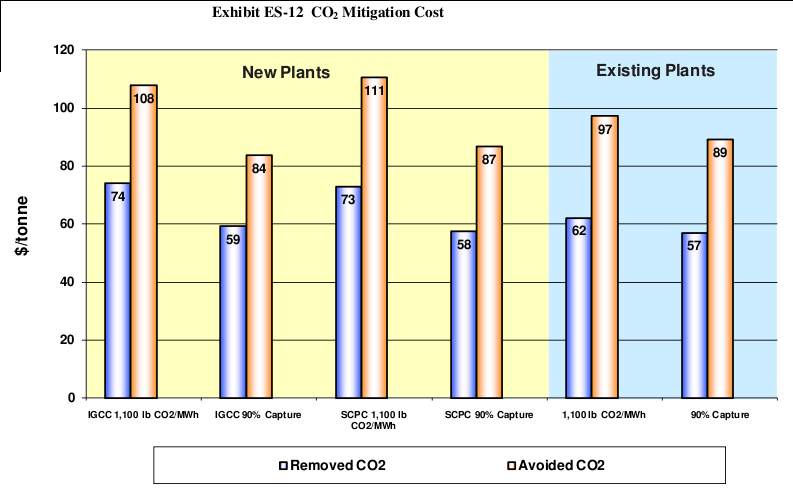
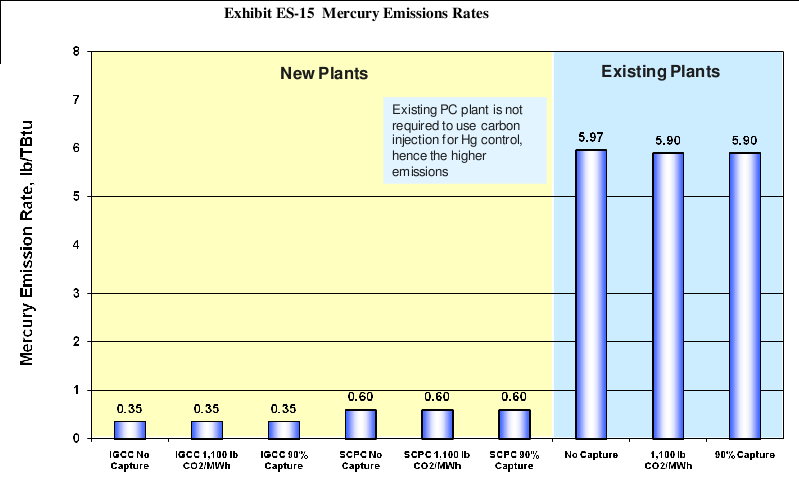
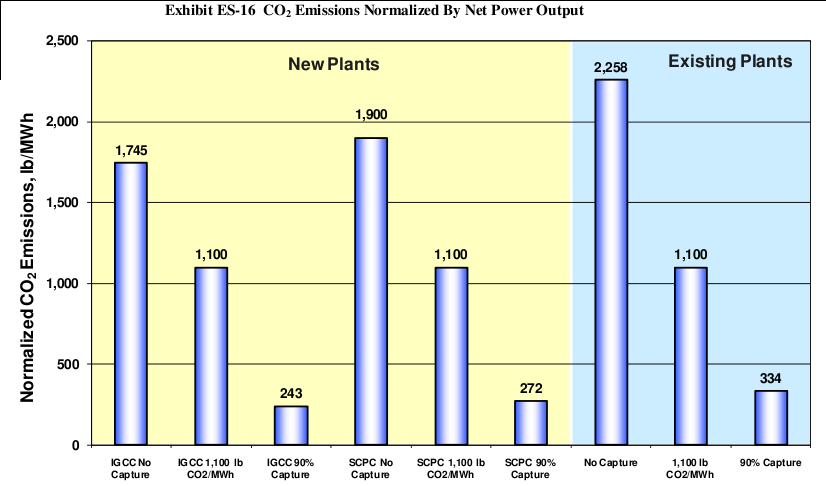
ENVIRONMENTAL PERFORMANCE The environmental targets for each power plant scenario are summarized in Exhibit ES-13 and emission rates of SO2, NOx, PM, Hg and CO2 are shown graphically in Exhibit ES-14 through Exhibit ES-16. Targets were chosen on the basis of the environmental regulations that would most likely apply to plants built in 2015.
Environmental targets were established for each of the scenarios as follows:
Emission Key Findings:
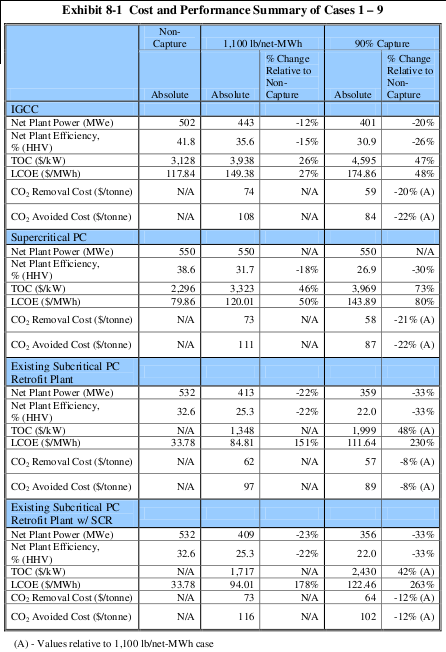
8. CONCLUSIONS The objective of this report was to present the baseline cost and performance of greenfield integrated gasification combined cycle (IGCC) plants, greenfield supercritical (SC) pulverized coal (PC) plants, and retrofit subcritical PC plants that limit carbon dioxide (CO2) emissions to various levels. For each plant type, three cases were modeled:
The intermediate value of 1,100 lb/net-MWh was chosen to match the recent interim California standard established in January 2007. The results show that the cost and performance of the technologies analyzed at this emission limit fall approximately half way between the non-capture cases and the 90 percent capture cases. While the cost and performance penalties incurred at the 1,100 lb CO2/net-MWh emission rate are less than for 90 percent capture, they are still substantial. The performance and cost results of the nine cases modeled in this study are summarized in Exhibit 8-1. The primary conclusions that can be drawn are:
Revision 2 Updates LIST OF ACRONYMS AND ABBREVIATIONS
ASSESSMENT OF POWER PLANTS THAT MEET PROPOSED GREENHOUSE GAS EMISSION PERFORMANCE STANDARDS Prepared by:Research and Development Solutions, LLC (RDS) Acknowledgments This report was prepared by Research and Development Solutions, LLC (RDS) for the UnitedStates Department of Energy’s National Energy Technology Laboratory. This work was completed under DOE NETL Contract Number DE-AC-26-04NT41817. This work was performed under RDS Subtask 41817.401.01.01.008. The authors wish to acknowledge the excellent guidance, contributions, and cooperation of the
( categories:
|
Support Civic Journalism Recent comments
Popular contentToday's:
All time:Last viewed:
|


