SearchUser loginOffice of CitizenRest in Peace,
Who's new
Subscribe |
CLEVELAND, OHIO – LOADED WITH ARTS, CULTURE, SPORTS, HOSPITALS, ETC. IS 2016’s MOST DISTRESSED LARGE U.S. CITYSubmitted by Satinder P S Puri on Sat, 03/05/2016 - 19:05.
CLEVELAND, OHIO – LOADED WITH ARTS, CULTURE, SPORTS, HOSPITALS, ETC. IS 2016’s MOST DISTRESSED LARGE U.S. CITY
*BOTTOM OF THE BARREL!
Cleveland, Ohio – an over 200-year old city on the shores of Lake Erie -- loaded with Arts (Cleveland Museum of Art, Cleveland Orchestra, Playhouse Square, etc.), Culture (Rock & Roll Hall of Fame, Great Lakes Science Center, etc.,) Sports (Browns, Cavaliers, and Indians), Hospitals (Cleveland Clinic and University Hospitals), etc. is 2016’s most distressed large U.S. city!
Says who?
The authors of a 38-page report titled: “The 2016 Distressed Communities Index.”
 *EIG (Economic Innovation Group): The report was published by EIG (Economic Innovation Group) – a Washington D.C. based group committed to “creating a more dynamic and innovative economy across America.”

*DCI (Distressed Communities Index): EIG uses what it calls the DCI (Distressed Communities Index) to “assess the economic well-being of communities across the U.S.”
According to EIG. “The DCI was built using data from more than 25,000 zip codes and covers 312 million Americans, or 99 percent of the population. Users can explore the dataset by zip code, county, city, state, and Congressional district.”
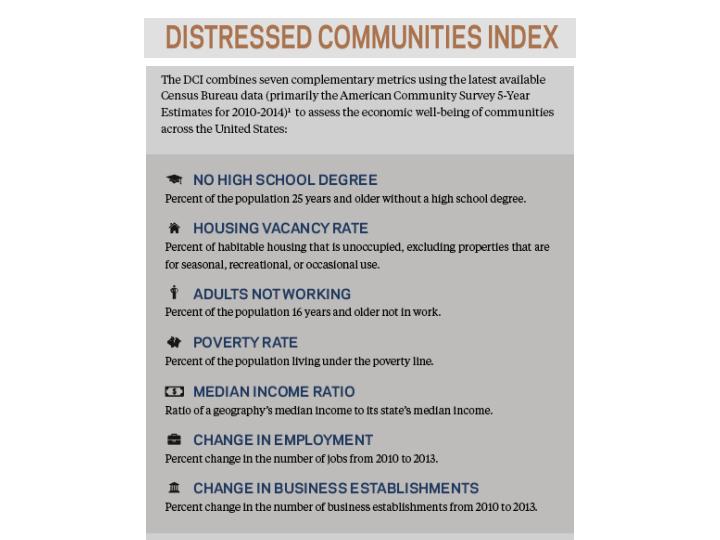
The DCI combines seven complementary metrics (economic indicators) to present a complete and multidimensional picture of economic distress–or prosperity–in U.S. communities:
1. No High School Degree: Percent of the population 25 years and over without a high school degree.
2. Housing vacancy: Percent of habitable housing that is unoccupied, excluding properties that are for seasonal, recreational, or occasional use.
3. Adults not working: Share of the population 16 years and over that is not currently employed.
4. Poverty: Percent of population living under the poverty line
5. Median income relative to state: Ratio of the geography’s median income to the state’s median income
6. Change in employment: Percent change in the number of individuals employed between 2010 and 2013
7. Change in business establishments: Percent change in the number of business establishments between 2010 and 2013
 *LINK TO EIG WEBSITE FOR 2016 REPORT:
*DISCUSSION OF REPORT ON CLEVELAND RADIO SHOW:
The EIG report: “The 2016 Distressed Communities Index” was discussed on three successive mornings (March 1, 2, and 3, 2016) on WCPN 90.3 FM Ideastream with host Mike McIntyre and his guests.
Please visit their website at the following link to play the audio broadcasts.
mso-fareast-font-family:"Times New Roman";mso-ansi-language:EN-US;mso-fareast-language:
Here are the approximate times for start of discussion on the report:
March 1: 0.00
March 2: 25.30
March 3: 33.50
*DISTRESSED V. PROSPEROUS LARGE U.S. CITIES IN 2016:
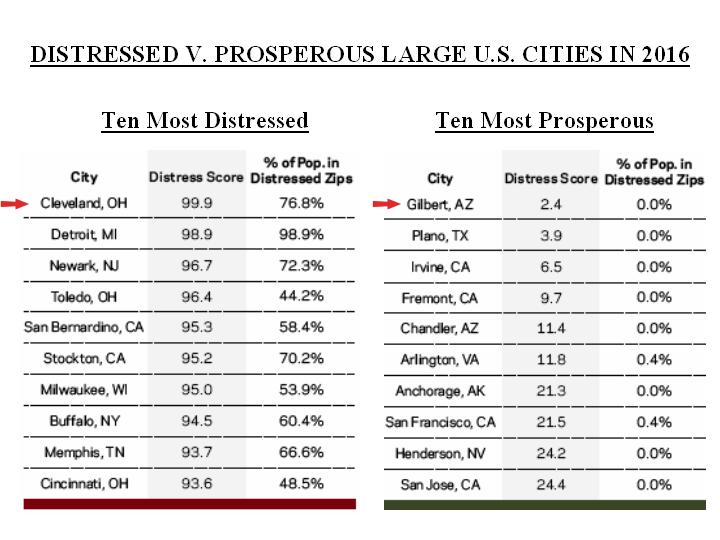
The table shows the ten most distressed and ten most prosperous U.S. large cities evaluated using the seven metrics in the DCI (Distressed Communities Index).
The ten most distressed large cities in 2016:
Cleveland,OH; Detroit MI; Newark, NJ; Toledo, OH; San Bernardino, CA; Stockton, CA; Milwaukee, WI; Buffalo, NY; Memphis, TN; and Cincinnati, OH.
The ten most prosperous large cities in 2016:
Gilbert, AZ; Plano, TX; Irvine, CA; Fremont, CA; Chandler, AZ; Arlington, VA; Anchorage, AK; San Francisco, CA; Henderson, NV; and San Jose, CA.
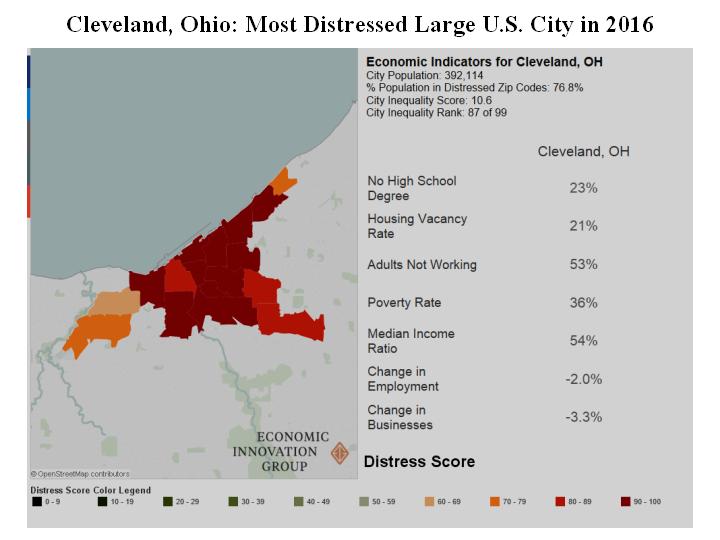
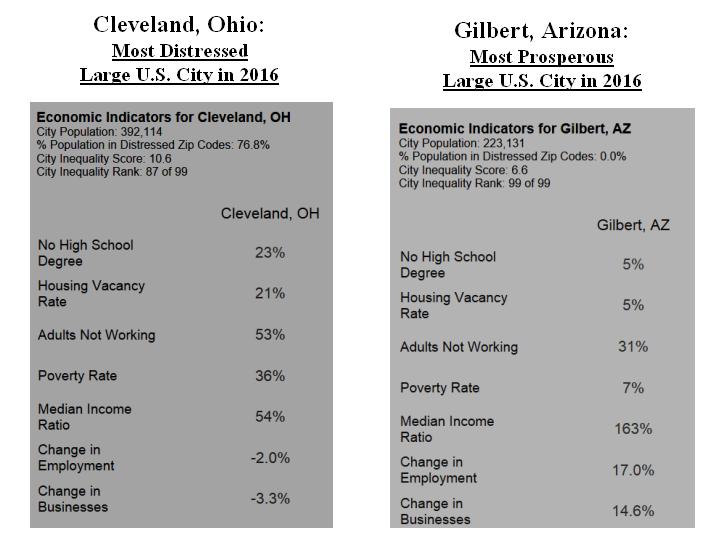
 *SEVEN ECONOMIC INDICATORS FOR CLEVELAND, OHIO: MOST DISTRESSED LARGE U.S. CITY IN 2016:
City Population: 392,114
% Population in Distressed Zip Codes: 76.8%
City Inequality Score: 10.6
City Inequality Rank: 87 of 99
The graphic shows the values for each indicator:
1. No High School Degree: 23%
2. Housing vacancy: 21%
3. Adults not working: 53%
4. Poverty: 36%
5. Median income relative to state: 54%
6. Change in employment: -2.0%
7. Change in business establishments: -3.3%
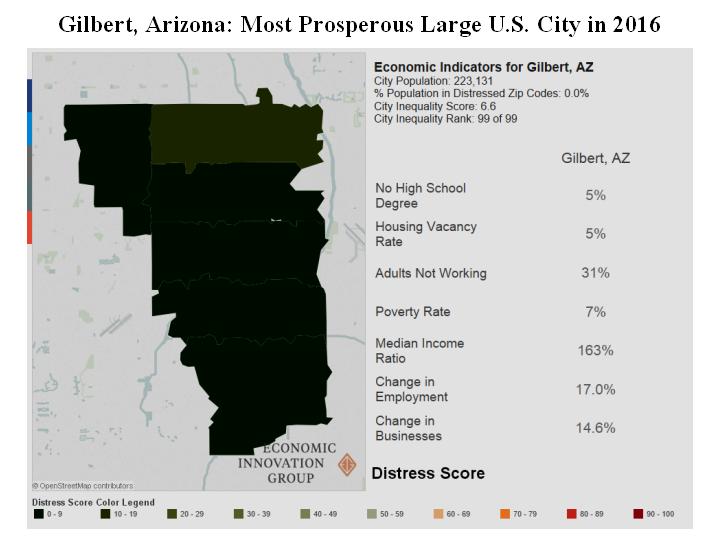
 *SEVEN ECONOMIC INDICATORS FOR GILBERT, ARIZONA: MOST PROSPEROUS LARGE U.S. CITY IN 2016:
City Population: 223, 131
% Population in Distressed Zip Codes: 0.0%
City Inequality Score: 6.6
City Inequality Rank: 99 of 99
The graphic shows the values for each indicator:
1 No High School Degree: 5%
2. Housing vacancy: 5%
3. Adults not working: 31%
4. Poverty: 7%
5. Median income relative to state: 163%
6. Change in employment: 17%
7. Change in business establishments: 14.6%
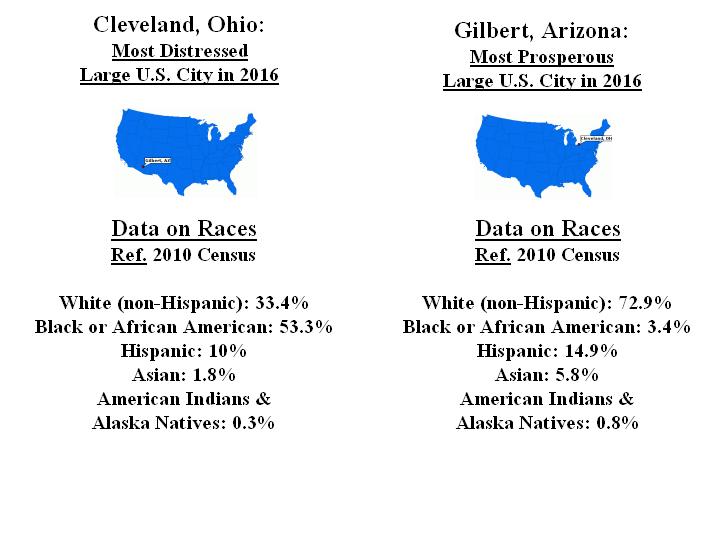
*2010 CENSUS DATA ON RACES:
As the subject report does not include any data on the races in each city, the following information has been added for Cleveland, OH and Gilbert, AZ.
CLEVELAND, OHIO: MOST DISTRESSED LARGE U.S. CITY IN 2016:
White (non-Hispanic): 33.4%
Black or African American: 53.3%
Hispanic: 10%
Asian: 1.8%
American Indians &
Alaska Natives: 0.3%
GILBERT, ARIZONA: MOST PROSPEROUS LARGE U.S. CITY IN 2016:
White (non-Hispanic): 72.9%
Black or African American: 3.4%
Hispanic: 14.9%
Asian: 5.8%
American Indians &
Alaska Natives: 0.8%
|
Support Civic Journalism Recent commentsPopular contentToday's:
All time:Last viewed:
|


Leveland distressed by it's 3 sports teams, healthcare, etc?
Could it be that just the "features" that are touted by the Downtown Cleveland Partnership and other business supporters actually contribute to the distress of Cleveland? In Many healthy urban areas - say Boston or NYC, for example - sports facilities are privately owned - not publicly owed as they are in Cle.
Maybe the set up in Cleveland and Cuyahoga County is actually contributing to economic inequality here.
Or maybe I don't know JACK....