SearchUser loginThe Origins of REALNEOOffice of CitizenRest in Peace,
Who's new
Subscribe |
On Measuring a Sustainable NEO, to Manage a Sustainable NEOSubmitted by Norm Roulet on Tue, 02/24/2009 - 04:40.
This was your NEO
This is your NEO on FFOEF
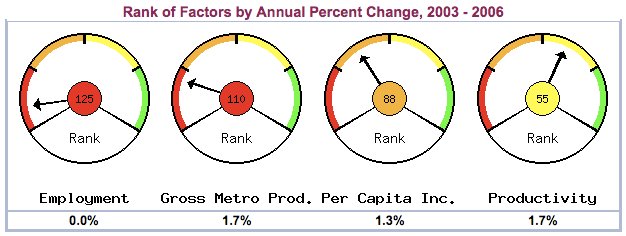
You should have many questions! The organizing committee of the Fund For Our Economic Future designed and established a set of metrics and methods for measuring and reporting the condition of our regional economy, developed under their command by consultants they paid and directed, which is now administered by Cleveland State University, and which measures metrics for prioritizing public initiatives... OUR “Dashboard Indicators for the Northeast Ohio Regional Economy” Are you aware of the weight given these metrics of your economy, and community, upon which you were not consulted, which influence regional policy and public spending? Do these metrics at all represent your interests? Do you even know? As a competitive analyst, the first place I look for such answers, in this big, open world, is in places other than where I am trying to analyze... how do other communities around the world measure their economy? What I have found, from just preliminary investigation, is far worse than I imagined. Not only do we not have a good “Dashboard” of our economy, we have approached the challenge completely wrong, are decades behind developing a good performance management process, and our failure to succeed with that is a major factor in the failure of our region, at every level. We haven't managed what we didn't measure, and we have measured far less than needed, and managed even that very poorly. On REALNEO, rooted and starting here, we will explore how the best communities in the world are using the best economic measurement tools and approaches to make their communities better. But first, we must dissect how we came to be where we are today, which is allowing the Fund For Our Economic Future to manage the performance of our economy in Northeast Ohio, without good measures. According to “Dashboard Indicators for the Northeast Ohio Economy: Prepared for the Fund for Our Economic Future”, an April, 2006 “working paper” by Randall Eberts, George Erickcek, and Jack Kleinhenz, published by the Cleveland Federal Reserve Bank (430 KB .PDF file attached here): The Fund for Our Economic Future (The Fund) is a multiyear collaborative effort “to encourage and advance a common and highly focused regional economic development agenda that can lead to a long-term economic transformation of the Northeast Ohio (NEO) economy.” One of the strategies pursued by the Fund is to create and regularly update Dashboard Indicators for the Northeast Ohio Regional Economy. The Dashboard is intended to provide a framework for understanding the regional economic process and to track the region’s economic progress. Randall Eberts and George Erickcek are at the W.E. Upjohn Institute for Employment Research, and Jack Kleinhenz is at Kleinhenz and Associates. In the introduction, the authors write: The methodology is noteworthy in that it yields indicators that reflect the key features of the underlying process of economic growth in the region. Basing the NEO indicators on such a methodology sets them apart from those created for other regions. Too often, indicators that are interesting and seemingly useful are assembled into a reporting system with the idea that the user can pick and choose. Stakeholders have little way of knowing which indicators track key factors in the region’s economic development process. The NEO indicators, on the other hand, are constructed from the viewpoint of “less is more.” We include only those indicators that closely relate to regional economic growth and that are critical for understanding and tracking the regional growth process. They go on to explain how they selected the indicators included in the dashboard: Our approach to developing the Dashboard Indicators was based upon rigorous empirical analysis. The analysis identifies broad factors that are associated with the economic growth of metropolitan areas. By estimating the extent to which these factors are correlated with economic growth, they provide a framework for prioritizing public initiatives. The Dashboard Indicators were developed in seven steps. 1. The organizing committee of the Fund for Our Economic Future outlined five themes of regional growth that they wanted to investigate or track... The themes and the subcategories identified for each are displayed in table 2. Table 2. Conceptual Themes of the Regional Framework Economic Growth and Employment Education and Workforce Equity and Fairness Quality of Life and Place Cooperation and Governance Which led to development of the indicators tracked in the Dashboard: Table 3. Variables Associated with the Five Themes of Regional Development Offered by the Organizing Committee I. Economic Growth and Employment II. Education and Workforce III. Equity and Fairness IV. Quality of Life and Place As America enters a new era of social consciousness and economic enlightenment, under new leadership, it is time for citizens of NEO to really evaluate these “Dashboard Indicators for the Northeast Ohio Regional Economy”, “constructed from the viewpoint of “less is more”, selected when an “organizing committee of the Fund for Our Economic Future outlined five themes of regional growth that they wanted to investigate or track...”... to “provide a framework for prioritizing public initiatives”. In a challenge to this dashboard design concept, process, and outcomes, and to other related top-down planning processes associated with the organizers of the Fund For Our Economic Future, I write, in “Preamble: Real Co-op for Open Food, Information and Community Development 2009”: This Dashboard has been leveraged to inflict great social harm, at great real and opportunity cost to the people of the region. The Dashboard is designed to create the appearance performance measures are in place to gauge the effectiveness of Their economic strategies, when the measures are dated and generic to a degree where no relevant performance connections may be drawn. That in a time when global data has become overly-plentiful, real-time, and interconnected world-wide, at the speed of light! The insincerity of the Dashboard is especially glaring as taxpayers have funded significant amounts of public money developing “state of the art” geographical and other data systems at CSU, which developed the Dashboard, and Case, through NEOCANDO, and at all levels of government, all of which are intended to be funded further through our HUD Neighborhood Stabalization Program grant funds... none of which are being used effectively for economic development. In their 2008 report, the Dashboard authors write in the credits: “Special thanks go to Bradley Whitehead, Robert Jaquay, and Christopher Thompson of the Fund for Our Economic Future for continued support and guidance throughout the preparation of the report.” Because the Dashboard data is at least two years out of date, yet the Dashboard is validated by both Foundation and University “experts”, it may effectively bury poor results of poor initiatives and poor strategies for many years, during which time $ billions in public money may be misallocated and largely squandered. The most recent update of the Dashboard, in November, 2008, presents data from 2006, with the full disclosure the data is too out-of-date to be useful in evaluating the performance of Their economic development initiatives currently underway. What results there are, for the period up to 2006, are dismal, showing declining performance of our economy in all but a few aspects measured by the Dashboard, with certainty most results included in the Dashboard will show further decline in 2007, 2008, 2009, and beyond, if something isn't done to change much about our current strategies, and how they are developed, implemented, and measured. What They are instead doing is explaining away the failure of the Dashboard and results reported there, exploiting the hard economic times here and worldwide, saying all performance objectives are off – They say They can't be measured in hard economic times. Here is their conclusion... see if you agree, and want to bank your future on their strategy.: This study shows that the economic performance of Northeast Ohio continues to be modest in comparison to other regions of the country and even in comparison to other metropolitan areas in the Midwest that share a similar social and economic history with Northeast Ohio. Several new state and regional initiatives in Northeast Ohio began only a few years ago and the 2006 data used in this report are too recent to reflect the outcomes of those actions. Furthermore, we should not expect to be able to reverse regional growth patterns in 1–or even 5– years. With the increased momentum of the initiatives put in place in recent years and additional new plans to improve our region, we can expect that Northeast Ohio will improve its economic trajectory in the next 10- to-15 years. However, other regions have also been engaged in accelerating their economic progress, so NEO’s future performance in comparison to other regions remains unknown. Therefore it is important to continue to invest in the economic transformation of Northeast Ohio and continue monitoring the progress of Northeast Ohio over time and in comparison to other regions in the United States. The results of poor leadership, poor management and poor strategies are measured in real econometrics, every day, and all that is easily captured and documented in near and real time, if you want useful management information. Considering design flaws and the heavy hand of Fund For Our Economic Future clearly in control of the regional economic development visioning process, $ billions in taxpayer dollars at stake, and the outcomes already measurably poor, by the Fund's own devices, where do the good people of NEO look for better solutions for the future? I conclude the Preamble stating: To prove all that, and put us on the right performance management track, we need to develop a more effective set of metrics and performance measurement and management capabilities for our region... and we need to trly engage the people of the regon in the process. Time to get started on this. Off in Seattle... we'll learn together from there...
|
Support Civic Journalism Recent commentsPopular contentToday's:
All time:Last viewed:
|


I continue to be amazed at
I continue to be amazed at the idea that NEO (or anywhere) will somehow experience "growth".
We are experiencing shrinkage worldwide. Let's get with the program.
Here's what I think we can grow - food. And it's gonna be pretty important.
Closing the 'Collapse Gap': the USSR was better prepared for collapse than the US by Dmitry Orlov
If we are going to have any energy, wind, solar and geothermal needed to have started yesterday. Let's stop studying and put the renewables to work today. And, conserve, conserve, conserve. I have been considering a weekly or monthly home blackout - just say no to electricity - one day.
Norm - I look forward to your rewrite of the dashboard.
CLEVELAND FOUNDATION VERY EFFECTIVE IN KILLING CLEVELAND
Norm, thank you for the sad review of FFOEF.
A large part of the continued economic collapse of Cleveland can be laid at the steps of the Cleveland Foundation. For decades they have been taking what is the public's money (being the recipients of donor money which relieved the donors of federal taxes) and used it in one instance after another to make/support decisions for established Cleveland corporate entities - like the Port Authority (Gave $25,000 to lobby for extending Port tax) and the Downtown Cleveland Partnership (homeless parking meters) and the Wind "task force" (gave BP's Stuebi plus Sci Mu "turbine" and other $), and the RockRHF - while every local community in which they dabble (Fairfax, Glenville, etc) has deteriorated over the last 40 years. And on issues like the County proposed Breuer building demo, livable wage legislation in Cleveland, and putitontheballot MEDCON tax hike, CF is speachless.
They have their little money IVs stuck in everywhere, seducing $tarved creativity to pander to their cha-ching, and influencing the politicians and pro-actively influencing government decisions, yet are not accountable in any way to the taxpayers or voters.
CF pres. Ronn Richard as Ohio's infrastructure CZAR!?. As if he needed a second job on top of the almost 1/2 million he already pulls down from a non-profit. Czar Richard was an embarrassing choice made by Strickland.
The Cleveland Foundation - HELPING SHRINK NEO!
Ad nauseum-metrics
http://vibrantneo.org/neoscc/missionvaluesoutcome/