I'm actually preparing my report on all this for the CTO of America
Submitted by Norm Roulet on Fri, 08/06/2010 - 09:10.
Medical Center Company hearing on Tuesday!
| Norm Roulet <norm [dot] roulet [at] gmail [dot] com> |
Fri, Aug 6, 2010 at 10:07 AM |
|
To: "Reitman, Mattie" <mattie [dot] reitman [at] sierraclub [dot] org>
|
|
Mattie,
I'm actually preparing my report on all this for the CIO (CTO) of America, who I have met and have direct access - he is a young Googlie techie Indian-American who embraces open source and innovation of the world through technology - what I am realizing is there has been an intentional crippling of the entire nation's environmental monitoring - this stuff the EPA is using is the worst implementation of IT I have ever seen and it is how we measure our pollution for the world...
Get it... for the world...?!
This is old tech put in place in the Bush era to keep the world from knowing how polluted we are - how polluting we are - to hide that from the world to make us look better than we are - Bush was gaming the entire world on pollution and we lose.
As such, it has all sorts of security holes, backdoors, and structural flaws designed into it, and is designed to be corrupted at any and all times... zero accountability.
All the environmental technology and science I've seen in use in our communities in America is complete crap.
Pollution monitoring should be in the hands of citizens - the data in the hands of citizens - like I told you.. the Sierra Club should be the gatekeeper for America if not the world on that... I know how easy that is to do (remember, we're just replacing crap) - we will save taxpayers $trillions and add years to each future American's lives... and we will be able to measure every penny of that.... if the world survives


On Fri, Aug 6, 2010 at 9:44 AM, Reitman, Mattie <mattie [dot] reitman [at] sierraclub [dot] org> wrote:
I was lucky enough to be a young teenager before all these user-friendly web editing things were hatched, so I know basic html, though that code is beyond me - any functions I don't already know are just gibberish!
This data maneuvering seems sketchy for sure. I'm glad you're on watch.
-m!-
On Fri, Aug 6, 2010 at 2:35 AM, Norm Roulet <norm [dot] roulet [at] gmail [dot] com> wrote:
Beginning of tonight's deceptions... the trolls are working overtime...
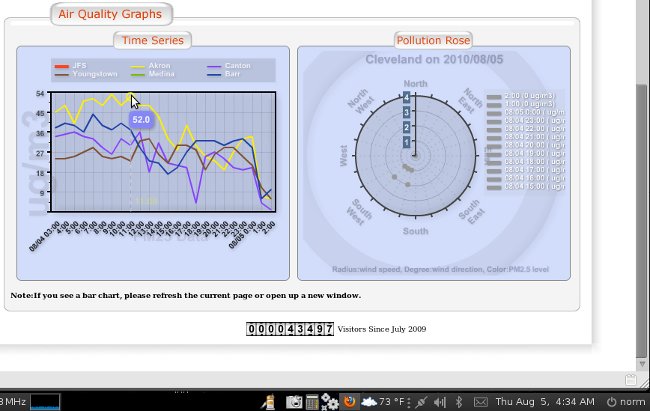
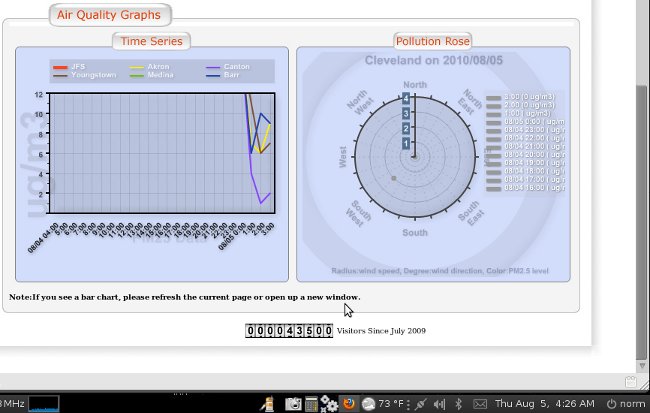
Before the trolls hit...
Trolls take system down...
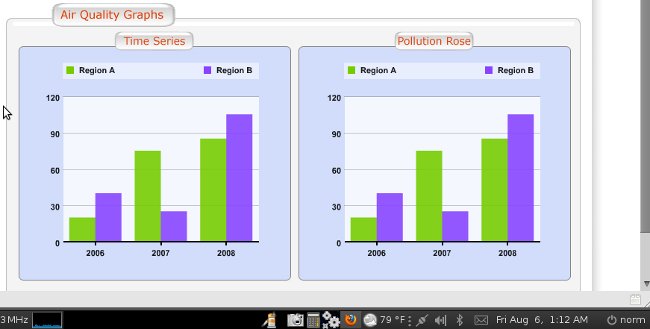
After the trolls hit... RAISING data... probably because it was incorrectly lowered earlier... this is not technology at work...
| |
OU... some professor's house... EPA Ohio HQ?
All the data revised in a matter of minutes, all over a one hour update..
See attached
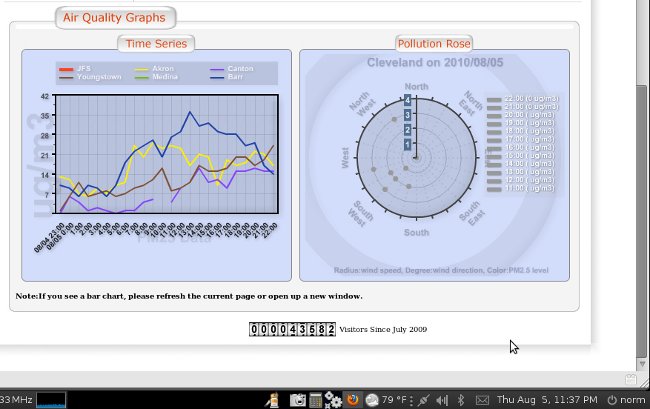
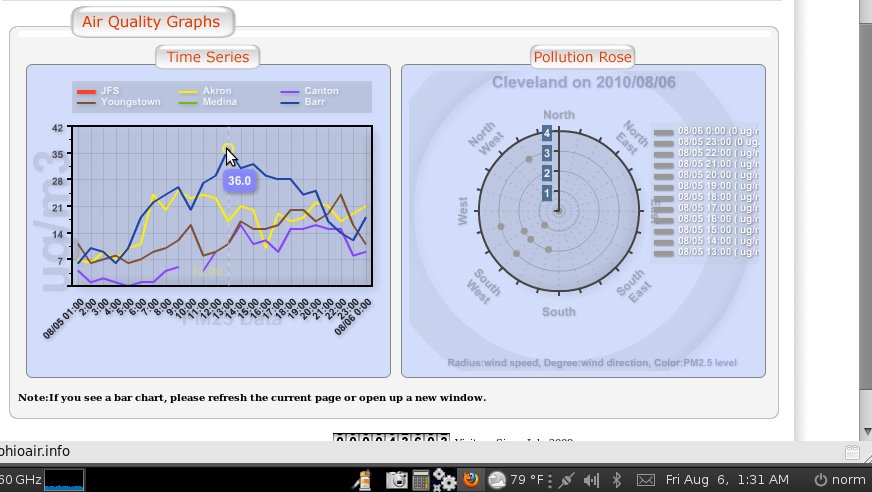
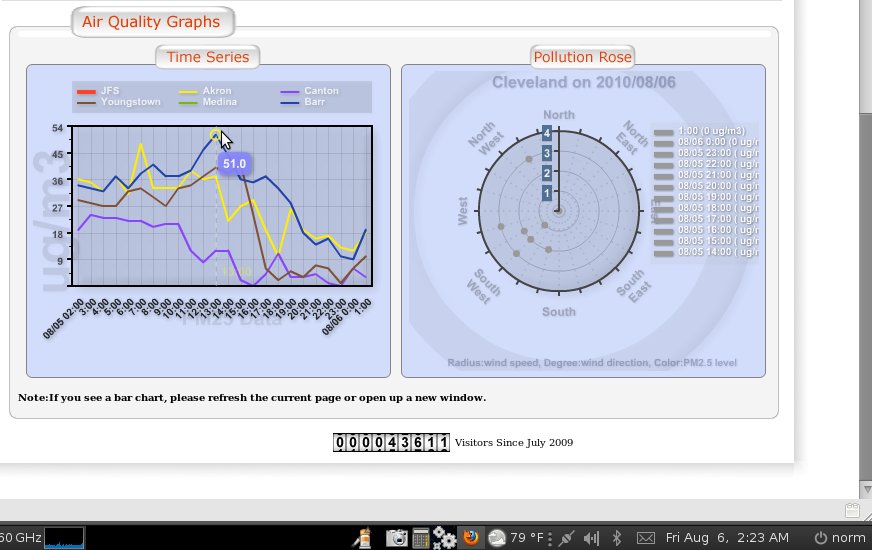
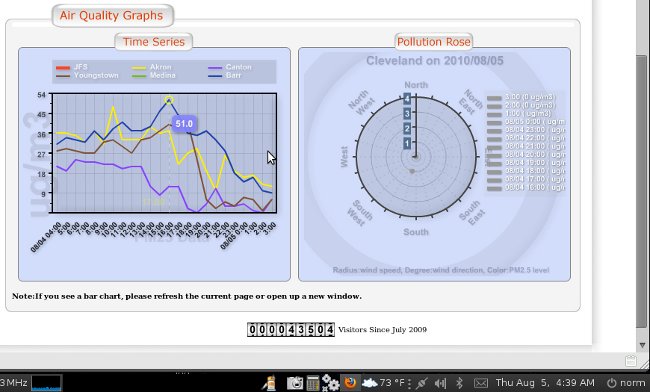
BTW - what you are seeing in these charts is a massive thounderstorm that flew through the Cleveland area right at 12 midnight August 5 - the data fall is quite beautiful and as expected...
Then the data from before midnight is stripped out of the chart
And then the chart is updated for before midnight with all the data manually adjusted as a slope rather than a fall, ignoring the fact there was a thunderstorm completely... seems like someone out of town is playing with our data... they odo it all day every day... and some nights when they think they are being watched... but they are poor at covering their tracks...
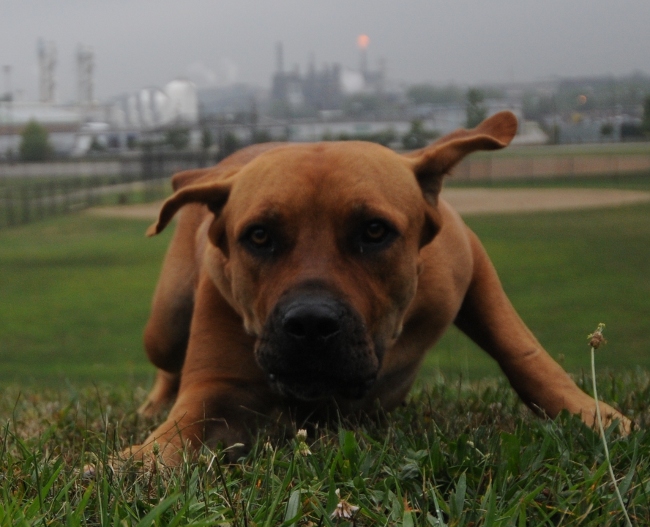
So I have photos to back up my claims our air is polluted when the data says otherwise...
making me wonder if the folloing post thunderstorm data for Cleveland is correct.. what was our level of pollution before the storm...
This is typical of why I started an investigation... and not even on a "bad" day...
I believe every day there are sites around Mittal with PM 2.5 over 210
June 3-16 - this raises issues from the past that carry on to the present.
When the monitors are on the air is severe - people never cared - they got sloppy and let the severe data show - I raised concerns - they've been playing this data hiding game ever since.
So what other code have they rewritten... and why is our air pollution technology designed so just anyone may rewrite the code?!?!
Serious issues! Not how such IT is done.. and this is the Federal Government.
On Fri, Aug 6, 2010 at 1:00 AM, Norm Roulet <norm [dot] roulet [at] gmail [dot] com> wrote:
Note all the data presented seems hard written into the code each day for each view - this is not a database driven application but just a flash of static data - you'll see this day's data below,,,
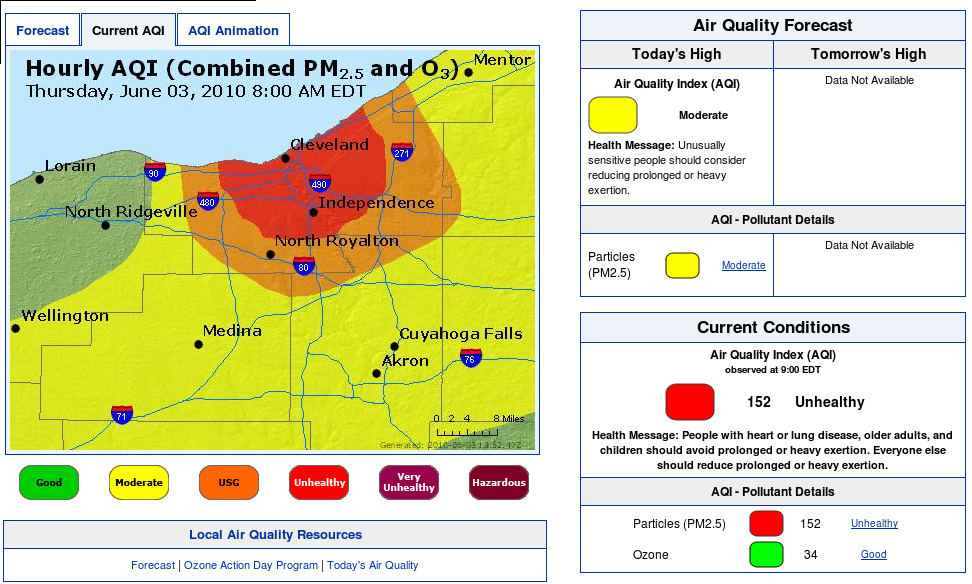
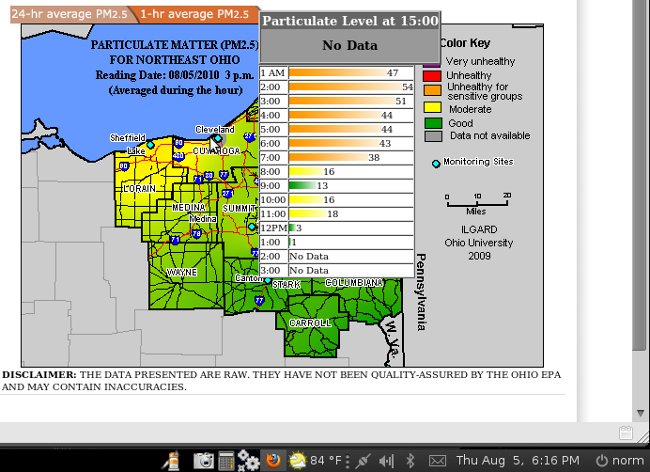
Here is the actual disclaimer - I think this was put in the code when I first raised the data issues around Memorial Day - and then it was replaced with the current disclaimer (both are in the code - I think they updated it wrong so the old NOTICE is still there but doesn't show in the flash presentation (bad code) - the original disclaimer is nearer to true, although an outrageous understatement.
<b> DISCLAIMER:</b>
THE DATA PRESENTED ARE RAW. THEY HAVE NOT BEEN QUALITY-ASSURED BY THE OHIO EPA AND MAY CONTAIN INACCURACIES.
<!--<b> <u>NOTICE:</u>
The PM2.5 monitors are experiencing difficulty this week. Data shown is incorrect.
Local air agencies are working with the monitors. In addition, high humidity is being reflected.
We appreciate <br>your patience. </b> -->
They seem to be acting with intent. I'm trying to determine exactly how - we'll need log files... this will take a few days.
<html>
<head>
<title>Current 24-hour PM2.5</title>
<style type="text/css">
<!--
body {
margin-left: 0px;
margin-top: 0px;
margin-right: 0px;
margin-bottom: 0px;
}
.style28 {
font-family: Verdana, Arial, Helvetica, sans-serif;
font-size: 9pt;
color: #666666;
}
.style1 {
font-family: Verdana, Arial, Helvetica, sans-serif;
font-size: 12px;
}
.style2 {font-size: 12}
.style3 {
font-family: Verdana, Arial, Helvetica, sans-serif;
font-weight: bold;
}
-->
</style>
<script language="javascript">AC_FL_RunContent = 0;</script>
<script language="javascript"> DetectFlashVer = 0; </script>
<script src="AC_RunActiveContent.js" language="javascript"></script>
<script language="JavaScript" type="text/javascript">
<!--
var requiredMajorVersion = 9;
var requiredMinorVersion = 0;
var requiredRevision = 45;
-->
</script>
</head>
<body LEFTMARGIN=0 TOPMARGIN=0 MARGINWIDTH=0 MARGINHEIGHT=0>
<table width="852" border="0" cellpadding="0" cellspacing="0">
<tr>
<td width="4" rowspan="2"></td>
<td rowspan="2"></td>
<td> </td>
<td colspan="4">
<a href="http://www.noaca.org"> <img src="images/top_heatherFP3.jpg" border=0> </a>
</td>
<td width="14"> </td>
</tr>
<tr>
<td align="right" valign="bottom"><img src="images/bar_coner_left_top.jpg" width="14" height="10"></td>
<td colspan="4"><img src="images/head_blank2.jpg" width="800" height="10"></td>
<td width="14" align="right"><img src="images/bar_coner_right_top.jpg" width="14" height="10"></td>
</tr>
<tr>
<td></td>
<td width="20" rowspan="6">
<table width="20" border="0">
<tr>
<td></td>
</tr>
</table> </td>
<td rowspan="5" valign="top" background="images/bar_left.jpg" width="14" height=50%></td>
<td colspan="4"><object classid="clsid:D27CDB6E-AE6D-11cf-96B8-444553540000" codebase="http://download.macromedia.com/pub/shockwave/cabs/flash/swflash.cab#version=6,0,29,0" width="800" height="130">
<param name="movie" value="images/noaca3_home.swf">
<param name="quality" value="high">
<embed src="images/noaca3_home.swf" width="800" height="130" quality="high" pluginspage="http://www.macromedia.com/go/getflashplayer" type="application/x-shockwave-flash"></embed>
</object></td>
<td rowspan="5" valign="top" background="images/bar_right.jpg" width="14" height=50% align="top"></td>
</tr>
<tr>
<td height="415"> </td>
<td width="180" valign="top"><p>
<object classid="clsid:D27CDB6E-AE6D-11cf-96B8-444553540000" codebase="http://download.macromedia.com/pub/shockwave/cabs/flash/swflash.cab#version=6,0,29,0" width="179" height="411" align="top">
<param name="movie" value="images/noaca_left_menuozone.swf">
<param name="quality" value="high">
<embed src="images/noaca_left_menuozone.swf" width="179" height="411" align="top" quality="high" pluginspage="http://www.macromedia.com/go/getflashplayer" type="application/x-shockwave-flash"></embed>
</object>
</p>
</td>
<td width="8"><div align="center"><img src="images/line.png" width="1" height="420" align="middle"></div></td>
<td width="608">
<div id="helpDiv7" style="filter:alpha(opacity=100); position: absolute; top:420; left:680; display: none">
<TABLE width=170 height=30 BORDER=2 CELLPADDING=0 CELLSPACING=0 BGCOLOR=#ffffff>
<TR>
<TD align=center valign=center>
<FONT FACE=verdana COLOR=#000000 SIZE=2>1-hr average PM<sub>2.5</sub> breakpoints (ug/m<sup>3</sup>)
</TD>
</TR>
</TABLE>
<TABLE width=170 height=30 BORDER=2 CELLPADDING=0 CELLSPACING=0 BGCOLOR=#990099>
<TR>
<TD align=center valign=center>
<FONT FACE=verdana COLOR=#FFFFFF SIZE=2>150 < PM<sub>2.5</sub> ≤ 250
</TD>
</TR>
</TABLE>
<TABLE width=170 height=30 BORDER=2 CELLPADDING=0 CELLSPACING=0 BGCOLOR=#ff0000>
<TR>
<TD align=center valign=center>
<FONT FACE=verdana COLOR=#FFFFFF SIZE=2>65 < PM<sub>2.5</sub> ≤ 150
</TD>
</TR>
</TABLE>
<TABLE width=170 height=30 BORDER=2 CELLPADDING=0 CELLSPACING=0 BGCOLOR=#ff9900>
<TR>
<TD align=center valign=center>
<FONT FACE=verdana COLOR=#FFFFFF SIZE=2>35 < PM<sub>2.5</sub> ≤ 65
</TD>
</TR>
</TABLE>
<TABLE width=170 height=30 BORDER=2 CELLPADDING=0 CELLSPACING=0 BGCOLOR=#FDE804>
<TR>
<TD align=center valign=center>
<FONT FACE=verdana COLOR=#FFFFFF SIZE=2>15 < PM<sub>2.5</sub> ≤ 35
</TD>
</TR>
</TABLE>
<TABLE width=170 height=30 BORDER=2 CELLPADDING=0 CELLSPACING=0 BGCOLOR=#009900>
<TR>
<TD align=center valign=center>
<FONT FACE=verdana COLOR=#FFFFFF SIZE=2>0 < PM<sub>2.5</sub> ≤ 15
</TD>
</TR>
</TABLE>
<TABLE width=170 height=30 BORDER=2 CELLPADDING=0 CELLSPACING=0 BGCOLOR=#999999>
<TR>
<TD align=center valign=center>
<FONT FACE=verdana COLOR=#FFFFFF SIZE=2>Data Not Available
</TD>
</TR>
</TABLE>
</div> <div id="helpDiv2" class="help" style="filter:alpha(opacity=100); position: absolute; z-index:30; top:250; left:540; display: none">
<TABLE width=195 BORDER=2 CELLPADDING=0 CELLSPACING=0 BGCOLOR=#666666><TR><TD><TABLE WIDTH=100% BORDER=0 CELLPADDING=0 CELLSPACING=0><TR><TD><CENTER><FONT FACE=verdana COLOR=#FFFFFF SIZE=2><B> Particulate Level at
21:00
</B></FONT></CENTER></TD></TR></TABLE><TABLE height=35 WIDTH=100% BORDER=0 CELLPADDING=2 CELLSPACING=0 BGCOLOR="#009A00
"><TR><TD><FONT face=verdana SIZE=2 COLOR=#010101><CENTER><b>
24hr average <br>,13µg/m<sup>3</sup> ,Good
</b></CENTER></FONT></TD></TR></TABLE></TD></TR>
</TABLE>
<script language="JavaScript1.2">
var graphimage="Level1.gif"
//DEFINE GRAPH VALUES [Item name, absolute value]
var graphx=new Array()
graphx[ 0]=["1 AM",2]
graphx[ 1]=[" 2:00",1]
graphx[ 2]=[" 3:00",1]
graphx[ 3]=[" 4:00",2]
graphx[ 4]=[" 5:00",1]
graphx[ 5]=[" 6:00",1]
graphx[ 6]=[" 7:00",0]
graphx[ 7]=[" 8:00",1]
graphx[ 8]=[" 9:00",2]
graphx[ 9]=["10:00",2]
graphx[10]=["11:00",2]
graphx[11]=["12PM",3]
graphx[12]=[" 1:00",4]
graphx[13]=[" 2:00",7]
graphx[14]=[" 3:00",8]
graphx[15]=[" 4:00",9]
graphx[16]=[" 5:00",9]
graphx[17]=[" 6:00",9]
graphx[18]=[" 7:00",11]
graphx[19]=[" 8:00",12]
graphx[20]=[" 9:00",13]
function graphit(g,gwidth){
total=0
for (i=0;i<g.length;i++)
total+=parseInt(g[i][1])
output='<table border="1" cellspacing="0" bgcolor="#ffffff" style="filter:alpha(opacity=100)" cellpadding="0">'
var NkickOut =true
for (i=0;i<g.length;i++){
concentration=Math.round(g[i][1])
if (i>0 && NkickOut) {
concentrationPre=Math.round(g[i-1][1]) }
else if (i<1) {
var concentrationPre = 40 }
var dif=concentration-concentrationPre
calwidth=Math.round(g[i][1]/gwidth*300)
if (concentration>0 && dif<45 && concentration<201){
if (concentration<16){
var graphimage="images/Level1.gif"}
else if (concentration>=16 && concentration<36){
var graphimage="images/Level2.gif"}
else if (concentration>=36 && concentration<66){
var graphimage="images/Level3.gif"}
else if (concentration>=66 && concentration<201){
var graphimage="images/Level4.gif" }
var NkickOut=true
var concentration=concentration
}
else {
var graphimage="images/Level1.gif"
calwidth=0
var concentration="No Data"
var NkickOut=false
}
output+='<tr><td><font face=verdana size=1>'+g[i][0]+'</font></td><td><img src="'+graphimage+'" width="'+calwidth+'" height="8"><font face=verdana size=1>'+concentration+'</font></td></tr>'
}
output+='</table>'
document.write(output+'<br><b></b>')
}
//CALL GRAPHIT FUNCTION
//graphit(NAME OF GRAPH ARRAY, MAXIMUM WIDTH IN PIXELS)
graphit(graphx,135)
</script>
</div> <div id="helpDiv6" class="help" style="filter:alpha(opacity=100); position: absolute; z-index:30; top:235; left:645; display: none">
<TABLE width=195 BORDER=2 CELLPADDING=0 CELLSPACING=0 BGCOLOR=#666666><TR><TD><TABLE WIDTH=100% BORDER=0 CELLPADDING=0 CELLSPACING=0><TR><TD><CENTER><FONT FACE=verdana COLOR=#FFFFFF SIZE=2><B> Particulate Level at
21:00
</B></FONT></CENTER></TD></TR></TABLE><TABLE height=35 WIDTH=100% BORDER=0 CELLPADDING=2 CELLSPACING=0 BGCOLOR="#FFFF01
"<TR><TD><FONT face=verdana SIZE=2 COLOR=#010101><CENTER><b>
24hr average <br>,23µg/m<sup>3</sup> ,Moderate
</b></CENTER></FONT></TD></TR></TABLE></TD></TR>
</TABLE>
<script language="JavaScript1.2">
var graphimage="Level1.gif"
//DEFINE GRAPH VALUES [Item name, absolute value]
var graphx=new Array()
graphx[ 0]=["1 AM",16]
graphx[ 1]=[" 2:00",20]
graphx[ 2]=[" 3:00",23]
graphx[ 3]=[" 4:00",27]
graphx[ 4]=[" 5:00",27]
graphx[ 5]=[" 6:00",27]
graphx[ 6]=[" 7:00",26]
graphx[ 7]=[" 8:00",27]
graphx[ 8]=[" 9:00",27]
graphx[ 9]=["10:00",30]
graphx[10]=["11:00",28]
graphx[11]=["12PM",25]
graphx[12]=[" 1:00",23]
function graphit(g,gwidth){
total=0
for (i=0;i<g.length;i++)
total+=parseInt(g[i][1])
output='<table border="1" cellspacing="0" bgcolor="#ffffff" style="filter:alpha(opacity=100)" cellpadding="0">'
var NkickOut =true
for (i=0;i<g.length;i++){
concentration=Math.round(g[i][1])
if (i>0 && NkickOut) {
concentrationPre=Math.round(g[i-1][1]) }
else if (i<1) {
var concentrationPre = 40 }
var dif=concentration-concentrationPre
calwidth=Math.round(g[i][1]/gwidth*300)
if (concentration>0 && dif<50 && concentration<201){
if (concentration<16){
var graphimage="images/Level1.gif"}
else if (concentration>=16 && concentration<36){
var graphimage="images/Level2.gif"}
else if (concentration>=36 && concentration<66){
var graphimage="images/Level3.gif"}
else if (concentration>=66 && concentration<201){
var graphimage="images/Level4.gif" }
var NkickOut=true
var concentration=concentration
}
else {
var graphimage="images/Level1.gif"
calwidth=0
var concentration="No Data"
var NkickOut=false
}
output+='<tr><td><font face=verdana size=1>'+g[i][0]+'</font></td><td><img src="'+graphimage+'" width="'+calwidth+'" height="8"><font face=verdana size=1>'+concentration+'</font></td></tr>'
}
output+='</table>'
document.write(output+'<br><b></b>')
}
//CALL GRAPHIT FUNCTION
//graphit(NAME OF GRAPH ARRAY, MAXIMUM WIDTH IN PIXELS)
graphit(graphx,135)
</script>
</div> <div id="helpDiv4" class="help" style="filter:alpha(opacity=100); position: absolute; z-index:30; top:240; left:650; display: none">
<TABLE width=195 BORDER=2 CELLPADDING=0 CELLSPACING=0 BGCOLOR=#666666><TR><TD><TABLE WIDTH=100% BORDER=0 CELLPADDING=0 CELLSPACING=0><TR><TD><CENTER><FONT FACE=verdana COLOR=#FFFFFF SIZE=2><B> Particulate Level at
21:00
</B></FONT></CENTER></TD></TR></TABLE><TABLE height=35 WIDTH=100% BORDER=0 CELLPADDING=2 CELLSPACING=0 BGCOLOR="#999999
"<TR><TD><FONT face=verdana SIZE=2 COLOR=#010101><CENTER><b>
24hr average <br>,14µg/m<sup>3</sup> ,No Data
</b></CENTER></FONT></TD></TR></TABLE></TD></TR>
</TABLE>
<script language="JavaScript1.2">
var graphimage="Level1.gif"
//DEFINE GRAPH VALUES [Item name, absolute value]
var graphx=new Array()
graphx[ 0]=["1 AM",6]
graphx[ 1]=[" 2:00",6]
graphx[ 2]=[" 3:00",7]
graphx[ 3]=[" 4:00",8]
graphx[ 4]=[" 5:00",6]
graphx[ 5]=[" 6:00",7]
graphx[ 6]=[" 7:00",7]
graphx[ 7]=[" 8:00",8]
graphx[ 8]=[" 9:00",8]
graphx[ 9]=["10:00",10]
graphx[10]=["11:00",10]
graphx[11]=["12PM",10]
graphx[12]=[" 1:00",10]
graphx[13]=[" 2:00",10]
graphx[14]=[" 3:00",11]
graphx[15]=[" 4:00",12]
graphx[16]=[" 5:00",13]
graphx[17]=[" 6:00",14]
graphx[18]=[" 7:00",15]
graphx[19]=[" 8:00",16]
graphx[20]=[" 9:00",14]
function graphit(g,gwidth){
total=0
for (i=0;i<g.length;i++)
total+=parseInt(g[i][1])
output='<table border="1" cellspacing="0" bgcolor="#ffffff" style="filter:alpha(opacity=100)" cellpadding="0">'
var NkickOut =true
for (i=0;i<g.length;i++){
concentration=Math.round(g[i][1])
if (i>0 && NkickOut) {
concentrationPre=Math.round(g[i-1][1]) }
else if (i<1) {
var concentrationPre = 40 }
var dif=concentration-concentrationPre
calwidth=Math.round(g[i][1]/gwidth*300)
if (concentration>0 && dif<50 && concentration<201){
if (concentration<16){
var graphimage="images/Level1.gif"}
else if (concentration>=16 && concentration<436){
var graphimage="images/Level2.gif"}
else if (concentration>=36 && concentration<66){
var graphimage="images/Level3.gif"}
else if (concentration>=66 && concentration<201){
var graphimage="images/Level4.gif" }
var NkickOut=true
var concentration=concentration
}
else {
var graphimage="images/Level1.gif"
calwidth=0
var concentration="No Data"
var NkickOut=false
}
output+='<tr><td><font face=verdana size=1>'+g[i][0]+'</font></td><td><img src="'+graphimage+'" width="'+calwidth+'" height="8"><font face=verdana size=1>'+concentration+'</font></td></tr>'
}
output+='</table>'
document.write(output+'<br><b></b>')
}
//CALL GRAPHIT FUNCTION
//graphit(NAME OF GRAPH ARRAY, MAXIMUM WIDTH IN PIXELS)
graphit(graphx,135)
</script>
</div> <div id="helpDiv3" class="help" style="filter:alpha(opacity=100); position: absolute; z-index:30; top:235; left:500; display: none">
<TABLE width=195 BORDER=2 CELLPADDING=0 CELLSPACING=0 BGCOLOR=#666666><TR><TD><TABLE WIDTH=100% BORDER=0 CELLPADDING=0 CELLSPACING=0><TR><TD><CENTER><FONT FACE=verdana COLOR=#FFFFFF SIZE=2><B> Particulate Level at
21:00
</B></FONT></CENTER></TD></TR></TABLE><TABLE height=35 WIDTH=100% BORDER=0 CELLPADDING=2 CELLSPACING=0 BGCOLOR="#009A00
"><TR><TD><FONT face=verdana SIZE=2 COLOR=#010101><CENTER><b>
24hr average <br>,4µg/m<sup>3</sup> ,Good
</b></CENTER></FONT></TD></TR></TABLE></TD></TR>
</TABLE>
<script language="JavaScript1.2">
var graphimage="Level1.gif"
//DEFINE GRAPH VALUES [Item name, absolute value]
var graphx=new Array()
graphx[ 0]=["1 AM",27]
graphx[ 1]=[" 2:00",34]
graphx[ 2]=[" 3:00",39]
graphx[ 3]=[" 4:00",49]
graphx[ 4]=[" 5:00",42]
graphx[ 5]=[" 6:00",40]
graphx[ 6]=[" 7:00",43]
graphx[ 7]=[" 8:00",38]
graphx[ 8]=[" 9:00",32]
graphx[ 9]=["10:00",28]
graphx[10]=["11:00",24]
graphx[11]=["12PM",22]
graphx[12]=[" 1:00",18]
graphx[13]=[" 2:00",15]
graphx[14]=[" 3:00",12]
graphx[15]=[" 4:00",10]
graphx[16]=[" 5:00",9]
graphx[17]=[" 6:00",7]
graphx[18]=[" 7:00",5]
graphx[19]=[" 8:00",5]
graphx[20]=[" 9:00",4]
function graphit(g,gwidth){
total=0
for (i=0;i<g.length;i++)
total+=parseInt(g[i][1])
output='<table border="1" cellspacing="0" bgcolor="#ffffff" style="filter:alpha(opacity=100)" cellpadding="0">'
var NkickOut =true
for (i=0;i<g.length;i++){
concentration=Math.round(g[i][1])
if (i>0 && NkickOut) {
concentrationPre=Math.round(g[i-1][1]) }
else if (i<1) {
var concentrationPre = 40 }
var dif=concentration-concentrationPre
calwidth=Math.round(g[i][1]/gwidth*300)
if (concentration>0 && dif<51 && concentration<201){
if (concentration<16){
var graphimage="images/Level1.gif"}
else if (concentration>=16 && concentration<36){
var graphimage="images/Level2.gif"}
else if (concentration>=36 && concentration<66){
var graphimage="images/Level3.gif"}
else if (concentration>=66 && concentration<201){
var graphimage="images/Level4.gif" }
var NkickOut=true
var concentration=concentration
}
else {
var graphimage="images/Level1.gif"
calwidth=0
var concentration="No Data"
var NkickOut=false
}
output+='<tr><td><font face=verdana size=1>'+g[i][0]+'</font></td><td><img src="'+graphimage+'" width="'+calwidth+'" height="8"><font face=verdana size=1>'+concentration+'</font></td></tr>'
}
output+='</table>'
document.write(output+'<br><b></b>')
}
//CALL GRAPHIT FUNCTION
//graphit(NAME OF GRAPH ARRAY, MAXIMUM WIDTH IN PIXELS)
graphit(graphx,135)
</script>
</div> <div id="helpDiv" class="help" style="filter:alpha(opacity=100); position: absolute; z-index:30; top:240; left:520; display: none">
<TABLE width=195 BORDER=2 CELLPADDING=0 CELLSPACING=0 BGCOLOR=#666666><TR><TD><TABLE WIDTH=100% BORDER=0 CELLPADDING=0 CELLSPACING=0><TR><TD><CENTER><FONT FACE=verdana COLOR=#FFFFFF SIZE=2><B> Particulate Level at
21:00
</B></FONT></CENTER></TD></TR></TABLE><TABLE height=35 WIDTH=100% BORDER=0 CELLPADDING=2 CELLSPACING=0 BGCOLOR="#FFFF01
"<TR><TD><FONT face=verdana SIZE=2 COLOR=#010101><CENTER><b>
24hr average <br>,19µg/m<sup>3</sup> ,Moderate
</b></CENTER></FONT></TD></TR></TABLE></TD></TR>
</TABLE>
<script language="JavaScript1.2">
var graphimage="Level1.gif"
//DEFINE GRAPH VALUES [Item name, absolute value]
var graphx=new Array()
graphx[ 0]=["1 AM",4]
graphx[ 1]=[" 2:00",4]
graphx[ 2]=[" 3:00",6]
graphx[ 3]=[" 4:00",7]
graphx[ 4]=[" 5:00",7]
graphx[ 5]=[" 6:00",8]
graphx[ 6]=[" 7:00",11]
graphx[ 7]=[" 8:00",13]
graphx[ 8]=[" 9:00",16]
graphx[ 9]=["10:00",18]
graphx[10]=["11:00",19]
graphx[11]=["12PM",19]
graphx[12]=[" 1:00",18]
graphx[13]=[" 2:00",19]
graphx[14]=[" 3:00",19]
graphx[15]=[" 4:00",18]
graphx[16]=[" 5:00",18]
graphx[17]=[" 6:00",18]
graphx[18]=[" 7:00",17]
graphx[19]=[" 8:00",19]
graphx[20]=[" 9:00",19]
function graphit(g,gwidth){
total=0
for (i=0;i<g.length;i++)
total+=parseInt(g[i][1])
output='<table border="1" cellspacing="0" bgcolor="#ffffff" style="filter:alpha(opacity=100)" cellpadding="0">'
var NkickOut =true
for (i=0;i<g.length;i++){
concentration=Math.round(g[i][1])
if (i>0 && NkickOut) {
concentrationPre=Math.round(g[i-1][1]) }
else if (i<1) {
var concentrationPre = 40 }
var dif=concentration-concentrationPre
calwidth=Math.round(g[i][1]/gwidth*300)
if (concentration>0 && dif<51 && concentration<201){
if (concentration<16){
var graphimage="images/Level1.gif"}
else if (concentration>=16 && concentration<36){
var graphimage="images/Level2.gif"}
else if (concentration>=36 && concentration<66){
var graphimage="images/Level3.gif"}
else if (concentration>=66 && concentration<201){
var graphimage="images/Level4.gif" }
var NkickOut=true
var concentration=concentration
}
else {
var graphimage="images/Level1.gif"
calwidth=0
var concentration="No Data"
var NkickOut=false
}
output+='<tr><td><font face=verdana size=1>'+g[i][0]+'</font></td><td><img src="'+graphimage+'" width="'+calwidth+'" height="8"><font face=verdana size=1>'+concentration+'</font></td></tr>'
}
output+='</table>'
document.write(output+'<br><b></b>')
}
//CALL GRAPHIT FUNCTION
//graphit(NAME OF GRAPH ARRAY, MAXIMUM WIDTH IN PIXELS)
graphit(graphx,135)
</script>
</div> <div id="helpDiv5" class="help" style="filter:alpha(opacity=100); position: absolute; z-index:30; top:240; left:460; display: none">
<TABLE width=195 BORDER=2 CELLPADDING=0 CELLSPACING=0 BGCOLOR=#666666><TR><TD><TABLE WIDTH=100% BORDER=0 CELLPADDING=0 CELLSPACING=0><TR><TD><CENTER><FONT FACE=verdana COLOR=#FFFFFF SIZE=2><B> Particulate Level at
21:00
</B></FONT></CENTER></TD></TR></TABLE><TABLE height=35 WIDTH=100% BORDER=0 CELLPADDING=2 CELLSPACING=0 BGCOLOR="#FFFF01
"<TR><TD><FONT face=verdana SIZE=2 COLOR=#010101><CENTER><b>
24hr average <br>,25µg/m<sup>3</sup> ,Moderate
</b></CENTER></FONT></TD></TR></TABLE></TD></TR>
</TABLE>
<script language="JavaScript1.2">
var graphimage="Level1.gif"
//DEFINE GRAPH VALUES [Item name, absolute value]
var graphx=new Array()
graphx[ 0]=["1 AM",16]
graphx[ 1]=[" 2:00",19]
graphx[ 2]=[" 3:00",22]
graphx[ 3]=[" 4:00",26]
graphx[ 4]=[" 5:00",25]
graphx[ 5]=[" 6:00",24]
graphx[ 6]=[" 7:00",25]
function graphit(g,gwidth){
total=0
for (i=0;i<g.length;i++)
total+=parseInt(g[i][1])
output='<table border="1" cellspacing="0" bgcolor="#ffffff" style="filter:alpha(opacity=100)" cellpadding="0">'
var NkickOut =true
for (i=0;i<g.length;i++){
concentration=Math.round(g[i][1])
if (i>0 && NkickOut) {
concentrationPre=Math.round(g[i-1][1]) }
else if (i<1) {
var concentrationPre = 40 }
var dif=concentration-concentrationPre
calwidth=Math.round(g[i][1]/gwidth*300)
if (concentration>0 && dif<51 && concentration<201){
if (concentration<16){
var graphimage="images/Level1.gif"}
else if (concentration>=16 && concentration<36){
var graphimage="images/Level2.gif"}
else if (concentration>=36 && concentration<66){
var graphimage="images/Level3.gif"}
else if (concentration>=66 && concentration<201){
var graphimage="images/Level4.gif" }
var NkickOut=true
var concentration=concentration
}
else {
var graphimage="images/Level1.gif"
calwidth=0
var concentration="No Data"
var NkickOut=false
}
output+='<tr><td><font face=verdana size=1>'+g[i][0]+'</font></td><td><img src="'+graphimage+'" width="'+calwidth+'" height="8"><font face=verdana size=1>'+concentration+'</font></td></tr>'
}
output+='</table>'
document.write(output+'<br><b></b>')
}
//CALL GRAPHIT FUNCTION
//graphit(NAME OF GRAPH ARRAY, MAXIMUM WIDTH IN PIXELS)
graphit(graphx,135)
</script>
</div> <div id="helpDiv8" class="help" style="filter:alpha(opacity=100); position: absolute; z-index:30; top:240; left:400; display: none">
<TABLE width=195 BORDER=2 CELLPADDING=0 CELLSPACING=0 BGCOLOR=#666666><TR><TD><TABLE WIDTH=100% BORDER=0 CELLPADDING=0 CELLSPACING=0><TR><TD><CENTER><FONT FACE=verdana COLOR=#FFFFFF SIZE=2><B> Particulate Level at
21:00
</B></FONT></CENTER></TD></TR></TABLE><TABLE height=35 WIDTH=100% BORDER=0 CELLPADDING=2 CELLSPACING=0 BGCOLOR="#FFFF01
"<TR><TD><FONT face=verdana SIZE=2 COLOR=#010101><CENTER><b>
24hr average <br>,25µg/m<sup>3</sup> ,Moderate
</b></CENTER></FONT></TD></TR></TABLE></TD></TR>
</TABLE>
<script language="JavaScript1.2">
var graphimage="Level1.gif"
//DEFINE GRAPH VALUES [Item name, absolute value]
var graphx=new Array()
graphx[ 0]=["1 AM",3]
graphx[ 1]=[" 2:00",6]
graphx[ 2]=[" 3:00",7]
graphx[ 3]=[" 4:00",7]
graphx[ 4]=[" 5:00",8]
graphx[ 5]=[" 6:00",9]
graphx[ 6]=[" 7:00",12]
graphx[ 7]=[" 8:00",15]
graphx[ 8]=[" 9:00",18]
graphx[ 9]=["10:00",19]
graphx[10]=["11:00",20]
graphx[11]=["12PM",21]
graphx[12]=[" 1:00",23]
graphx[13]=[" 2:00",23]
graphx[14]=[" 3:00",24]
graphx[15]=[" 4:00",25]
graphx[16]=[" 5:00",26]
graphx[17]=[" 6:00",27]
graphx[18]=[" 7:00",27]
graphx[19]=[" 8:00",26]
graphx[20]=[" 9:00",25]
function graphit(g,gwidth){
total=0
for (i=0;i<g.length;i++)
total+=parseInt(g[i][1])
output='<table border="1" cellspacing="0" bgcolor="#ffffff" style="filter:alpha(opacity=100)" cellpadding="0">'
var NkickOut =true
for (i=0;i<g.length;i++){
concentration=Math.round(g[i][1])
if (i>0 && NkickOut) {
concentrationPre=Math.round(g[i-1][1]) }
else if (i<1) {
var concentrationPre = 40 }
var dif=concentration-concentrationPre
calwidth=Math.round(g[i][1]/gwidth*300)
if (concentration>0 && dif<51 && concentration<201){
if (concentration<16){
var graphimage="images/Level1.gif"}
else if (concentration>=16 && concentration<36){
var graphimage="images/Level2.gif"}
else if (concentration>=36 && concentration<66){
var graphimage="images/Level3.gif"}
else if (concentration>=66 && concentration<201){
var graphimage="images/Level4.gif" }
var NkickOut=true
var concentration=concentration
}
else {
var graphimage="images/Level1.gif"
calwidth=0
var concentration="No Data"
var NkickOut=false
}
output+='<tr><td><font face=verdana size=1>'+g[i][0]+'</font></td><td><img src="'+graphimage+'" width="'+calwidth+'" height="8"><font face=verdana size=1>'+concentration+'</font></td></tr>'
}
output+='</table>'
document.write(output+'<br><b></b>')
}
//CALL GRAPHIT FUNCTION
//graphit(NAME OF GRAPH ARRAY, MAXIMUM WIDTH IN PIXELS)
graphit(graphx,135)
</script>
</div> <div id="helpDiv9" class="help" style="filter:alpha(opacity=100); position: absolute; z-index:30; top:230; left:600; display: none">
<TABLE width=195 BORDER=2 CELLPADDING=0 CELLSPACING=0 BGCOLOR=#666666><TR><TD><TABLE WIDTH=100% BORDER=0 CELLPADDING=0 CELLSPACING=0><TR><TD><CENTER><FONT FACE=verdana COLOR=#FFFFFF SIZE=2><B> Particulate Level at
21:00
</B></FONT></CENTER></TD></TR></TABLE><TABLE height=35 WIDTH=100% BORDER=0 CELLPADDING=2 CELLSPACING=0 BGCOLOR="#999999
"<TR><TD><FONT face=verdana SIZE=2 COLOR=#010101><CENTER><b>
24hr average <br>,-2147483648µg/m<sup>3</sup> ,No Data
</b></CENTER></FONT></TD></TR></TABLE></TD></TR>
</TABLE>
<script language="JavaScript1.2">
var graphimage="Level1.gif"
//DEFINE GRAPH VALUES [Item name, absolute value]
var graphx=new Array()
graphx[ 0]=["1 AM",-2147483648]
graphx[ 1]=[" 2:00",-2147483648]
graphx[ 2]=[" 3:00",-2147483648]
graphx[ 3]=[" 4:00",-2147483648]
graphx[ 4]=[" 5:00",-2147483648]
graphx[ 5]=[" 6:00",-2147483648]
graphx[ 6]=[" 7:00",-2147483648]
graphx[ 7]=[" 8:00",-2147483648]
graphx[ 8]=[" 9:00",-2147483648]
graphx[ 9]=["10:00",-2147483648]
graphx[10]=["11:00",-2147483648]
graphx[11]=["12PM",-2147483648]
graphx[12]=[" 1:00",-2147483648]
graphx[13]=[" 2:00",-2147483648]
graphx[14]=[" 3:00",-2147483648]
graphx[15]=[" 4:00",-2147483648]
graphx[16]=[" 5:00",-2147483648]
graphx[17]=[" 6:00",-2147483648]
graphx[18]=[" 7:00",-2147483648]
graphx[19]=[" 8:00",-2147483648]
graphx[20]=[" 9:00",-2147483648]
function graphit(g,gwidth){
total=0
for (i=0;i<g.length;i++)
total+=parseInt(g[i][1])
output='<table border="1" cellspacing="0" bgcolor="#ffffff" style="filter:alpha(opacity=100)" cellpadding="0">'
var NkickOut =true
for (i=0;i<g.length;i++){
concentration=Math.round(g[i][1])
if (i>0 && NkickOut) {
concentrationPre=Math.round(g[i-1][1]) }
else if (i<1) {
var concentrationPre = 40 }
var dif=concentration-concentrationPre
calwidth=Math.round(g[i][1]/gwidth*300)
if (concentration>0 && dif<51 && concentration<201){
if (concentration<16){
var graphimage="images/Level1.gif"}
else if (concentration>=16 && concentration<36){
var graphimage="images/Level2.gif"}
else if (concentration>=36 && concentration<66){
var graphimage="images/Level3.gif"}
else if (concentration>=66 && concentration<201){
var graphimage="images/Level4.gif" }
var NkickOut=true
var concentration=concentration
}
else {
var graphimage="images/Level1.gif"
calwidth=0
var concentration="No Data"
var NkickOut=false
}
output+='<tr><td><font face=verdana size=1>'+g[i][0]+'</font></td><td><img src="'+graphimage+'" width="'+calwidth+'" height="8"><font face=verdana size=1>'+concentration+'</font></td></tr>'
}
output+='</table>'
document.write(output+'<br><b></b>')
}
//CALL GRAPHIT FUNCTION
//graphit(NAME OF GRAPH ARRAY, MAXIMUM WIDTH IN PIXELS)
graphit(graphx,135)
</script>
</div> <div id="helpDiv10" class="help" style="filter:alpha(opacity=100); position: absolute; z-index:30; top:240; left:520; display: none">
<TABLE width=195 BORDER=2 CELLPADDING=0 CELLSPACING=0 BGCOLOR=#666666><TR><TD><TABLE WIDTH=100% BORDER=0 CELLPADDING=0 CELLSPACING=0><TR><TD><CENTER><FONT FACE=verdana COLOR=#FFFFFF SIZE=2><B> Particulate Level at
21:00
</B></FONT></CENTER></TD></TR></TABLE><TABLE height=35 WIDTH=100% BORDER=0 CELLPADDING=2 CELLSPACING=0 BGCOLOR="#FFFF01
"<TR><TD><FONT face=verdana SIZE=2 COLOR=#010101><CENTER><b>
24hr average <br>,20µg/m<sup>3</sup> ,Moderate
</b></CENTER></FONT></TD></TR></TABLE></TD></TR>
</TABLE>
<script language="JavaScript1.2">
var graphimage="Level1.gif"
//DEFINE GRAPH VALUES [Item name, absolute value]
var graphx=new Array()
graphx[ 0]=["1 AM",16]
graphx[ 1]=[" 2:00",16]
graphx[ 2]=[" 3:00",18]
graphx[ 3]=[" 4:00",23]
graphx[ 4]=[" 5:00",21]
graphx[ 5]=[" 6:00",23]
graphx[ 6]=[" 7:00",20]
function graphit(g,gwidth){
total=0
for (i=0;i<g.length;i++)
total+=parseInt(g[i][1])
output='<table border="1" cellspacing="0" bgcolor="#ffffff" style="filter:alpha(opacity=100)" cellpadding="0">'
var NkickOut =true
for (i=0;i<g.length;i++){
concentration=Math.round(g[i][1])
if (i>0 && NkickOut) {
concentrationPre=Math.round(g[i-1][1]) }
else if (i<1) {
var concentrationPre = 40 }
var dif=concentration-concentrationPre
calwidth=Math.round(g[i][1]/gwidth*300)
if (concentration>0 && dif<51 && concentration<201){
if (concentration<16){
var graphimage="images/Level1.gif"}
else if (concentration>=16 && concentration<36){
var graphimage="images/Level2.gif"}
else if (concentration>=36 && concentration<66){
var graphimage="images/Level3.gif"}
else if (concentration>=66 && concentration<201){
var graphimage="images/Level4.gif" }
var NkickOut=true
var concentration=concentration
}
else {
var graphimage="images/Level1.gif"
calwidth=0
var concentration="No Data"
var NkickOut=false
}
output+='<tr><td><font face=verdana size=1>'+g[i][0]+'</font></td><td><img src="'+graphimage+'" width="'+calwidth+'" height="8"><font face=verdana size=1>'+concentration+'</font></td></tr>'
}
output+='</table>'
document.write(output+'<br><b></b>')
}
//CALL GRAPHIT FUNCTION
//graphit(NAME OF GRAPH ARRAY, MAXIMUM WIDTH IN PIXELS)
graphit(graphx,135)
</script>
</div>
<img border=0 src="images/tap_24hr_average_PM25.jpg" width="288" height="19" usemap="#SubMenu"><br>
<map name="SubMenu">
<area shape="rect" coords="10,0,130,19" href=#>
<area shape="rect" coords="146,0,280,19" href=currentmap1hrPM25.asp>
</map>
<IMG border=0 height=367 src="../regions/northeast/pm25currentmap_aqi/latestmap.PNG" width=598 usemap="#Map">
<map name="Map">
<area shape="circle" coords="260,210,15" onMouseOver = "helpOn()" OnMouseOut = "helpOff()" >
<area shape="circle" coords="400,210,15" onMouseOver = "helpOn4()" OnMouseOut = "helpOff4()" >
<area shape="circle" coords="380,180,15" onMouseOver = "helpOn6()" OnMouseOut = "helpOff6()" >
<area shape="circle" coords="280,280,15" onMouseOver = "helpOn2()" OnMouseOut = "helpOff2()" >
<!-- <area shape="circle" coords="123,134,20" href="../history/moninfo.asp?moniname=plain_twp&pollutant=Ozone" onMouseOver = "helpOn1()" OnMouseOut = "helpOff1()">-->
<area shape="circle" coords="190,210,15" onMouseOver = "helpOn5()" OnMouseOut = "helpOff5()" > <!--Medina-->
<area shape="circle" coords="225,117,7" onMouseOver = "helpOn3()" OnMouseOut = "helpOff3()"> <!-- G_T_Craig-->
<!-- <area shape="circle" coords="225,129,7" onMouseOver = "helpOn3()" OnMouseOut = "helpOff3()"> --> <!-- G_T_Craig, it needs to be switched with the one above when the St.Theodo site is back to normal-->
<area shape="rect" coords="450,25,590,120" onMouseOver = "helpOn7()" OnMouseOut = "helpOff7()" >
<area shape="circle" coords="150,126,15" onMouseOver = "helpOn8()" OnMouseOut = "helpOff8()">
<area shape="circle" coords="300,65,15" onMouseOver = "helpOn9()" OnMouseOut = "helpOff9()">
<!-- <area shape="circle" coords="227,117,7" onMouseOver = "helpOn10()" OnMouseOut = "helpOff10()">--> <!-- St. Theodo, it needs to be activated when the St.Theodo site is back to normal-->
</map>
<script language="JavaScript">
function helpOn() {
helpDiv.style.display = "block";
}
function helpOff() {
helpDiv.style.display = "none";
}
function helpOn1() {
helpDiv1.style.display = "block";
}
function helpOff1() {
helpDiv1.style.display = "none";
}
function helpOn2() {
helpDiv2.style.display = "block";
}
function helpOff2() {
helpDiv2.style.display = "none";
}
function helpOn3() {
helpDiv3.style.display = "block";
}
function helpOff3() {
helpDiv3.style.display = "none";
}
function helpOn4() {
helpDiv4.style.display = "block";
}
function helpOff4() {
helpDiv4.style.display = "none";
}
function helpOn5() {
helpDiv5.style.display = "block";
}
function helpOff5() {
helpDiv5.style.display = "none";
}
function helpOn6() {
helpDiv6.style.display = "block";
}
function helpOff6() {
helpDiv6.style.display = "none";
}
function helpOn7() {
helpDiv7.style.display = "block"; } function helpOff7() { helpDiv7.style.display = "none"; } function helpOn8() { helpDiv8.style.display = "block"; } function helpOff8() { helpDiv8.style.display = "none"; } function helpOn9() { helpDiv9.style.display = "block"; } function helpOff9() { helpDiv9.style.display = "none"; } function helpOn10() { helpDiv10.style.display = "block"; } function helpOff10() { helpDiv10.style.display = "none"; } </script> <br> <font face='verdana' size='1'> <!-- color="#f80b0b"> -->
<b> DISCLAIMER:</b>
THE DATA PRESENTED ARE RAW. THEY HAVE NOT BEEN QUALITY-ASSURED BY THE OHIO EPA AND MAY CONTAIN INACCURACIES.
<!--<b> <u>NOTICE:</u>
The PM2.5 monitors are experiencing difficulty this week. Data shown is incorrect.
Local air agencies are working with the monitors. In addition, high humidity is being reflected.
We appreciate <br>your patience. </b> -->
</font> <td width="4"> </td> <!-- <table width="180" height="410" BORDER=0 CELLPADDING=0 CELLSPACING=0 BGCOLOR=#edf0ed > <tr> <td valign="top"> <br>
<font face='verdana' size='1'>
<b>NOTICE:</b><br> <br> You may review all of the day's readings by holding your mouse over any of the monitors. <br> <br> For quering the real time entire Ohio Air Quality, Please Click <a href=" http://ohioair.info/ohio/ohiopm25.asp">here.</a> <br> <br> <br> <b> DISCLAIMER:</b> <br> THE DATA PRESENTED ARE RAW. THEY HAVE NOT BEEN QUALITY-ASSURED BY THE OHIO EPA AND MAY CONTRAIN INACCURACIES. </b> </font> <br> </td> </tr> </table> --> </p> </td> <td width="4"> </td> </tr> <tr> <td height="19" rowspan="3"> </td> <td colspan="3" align="center"><img src=" images/line2.png" width="780" height="1"></td> <td> </td> </tr> <tr> <td colspan="4" align="center"><table width="784" border="0" cellpadding="0" cellspacing="0"> <tr> <td colspan="3" align="center"><img src=" images/box_titled_graphs.jpg" width="780" height="40"></td> </tr> <tr> <td background="images/box_middle_left.jpg" width="16" height=100%></td> <td width="752" align="left" valign="top" bgcolor="f4f4f4"><table width="750" border="0" cellpadding="0" cellspacing="0"> <tr> <td colspan="3"><img src=" images/inner_box_top_timeseries.jpg" width="375" height="30"></td> <td colspan="3"><img src=" images/inner_box_top_pollutionrose.jpg" width="375" height="30"></td> </tr> <tr> <td width=14 rowspan="3" background="images/inner_box_middle_small2.jpg"> </td> <td width="352" bgcolor="d2ddfb"></td> <td width="9" rowspan="3" background="images/inner_box_middle_right_small.jpg"> </td> <td width=15 rowspan="3" background="images/inner_box_middle_small2.jpg"> </td> <td width="351" rowspan="2" align="center" valign="top" bgcolor="d2ddfb"> <span class="style28">
<script language="JavaScript" type="text/javascript">
<!--
if (AC_FL_RunContent == 0 || DetectFlashVer == 0) { alert("This page requires AC_RunActiveContent.js."); } else { var hasRightVersion = DetectFlashVer(requiredMajorVersion, requiredMinorVersion, requiredRevision); if(hasRightVersion) { AC_FL_RunContent( 'codebase', ' http://download.macromedia.com/pub/shockwave/cabs/flash/swflash.cab#version=9,0,45,0', 'width', '350', 'height', '300', 'scale', 'noscale', 'salign', 'TL', 'bgcolor', '4a5d6e', 'wmode', 'transparent', 'movie', 'charts', 'src', 'charts', 'FlashVars', 'timeout=50&retry=3&spinning_wheel=true&library_path=charts_library&xml_source=samplePolar_live.php', 'id', 'my_chart', 'name', 'my_chart', 'menu', 'true', 'allowFullScreen', 'true', 'allowScriptAccess','sameDomain', 'quality', 'high', 'align', 'middle', 'pluginspage', ' http://www.macromedia.com/go/getflashplayer', 'play', 'true', 'devicefont', 'false' ); } else { var alternateContent = 'This content requires the Adobe Flash Player. ' + '<u><a href= http://www.macromedia.com/go/getflash/>Get Flash</a></u>.'; document.write(alternateContent); } } // --> </script> </span> </td> <td width="9" rowspan="3" background="images/inner_box_middle_right_small.jpg"> </td> </tr> <tr> <td align="center" valign="top" bgcolor="d2ddfb"> <div align="left"><span class="style28">
<script language="JavaScript" type="text/javascript">
<!--
if (AC_FL_RunContent == 0 || DetectFlashVer == 0) { alert("This page requires AC_RunActiveContent.js."); } else { var hasRightVersion = DetectFlashVer(requiredMajorVersion, requiredMinorVersion, requiredRevision); if(hasRightVersion) { AC_FL_RunContent( 'codebase', ' http://download.macromedia.com/pub/shockwave/cabs/flash/swflash.cab#version=9,0,45,0', 'width', '350', 'height', '300', 'scale', 'noscale', 'salign', 'TL', 'bgcolor', '4a5d6e', 'wmode', 'transparent', 'movie', 'charts', 'src', 'charts', 'FlashVars', 'timeout=50&retry=3&spinning_wheel=true&library_path=charts_library&xml_source=sample3_live.php', 'id', 'my_chart', 'name', 'my_chart', 'menu', 'true', 'allowFullScreen', 'true', 'allowScriptAccess','sameDomain', 'quality', 'high', 'align', 'middle', 'pluginspage', ' http://www.macromedia.com/go/getflashplayer', 'play', 'true', 'devicefont', 'false' ); } else { var alternateContent = 'This content requires the Adobe Flash Player. ' + '<u><a href= http://www.macromedia.com/go/getflash/>Get Flash</a></u>.'; document.write(alternateContent); } } // --> </script> </span> </div></td> </tr> <tr> <td valign="top" bgcolor="d2ddfb"></td> <td valign="top" bgcolor="d2ddfb"></td> </tr> <tr> <td colspan="3"><img src=" images/inner_box_bottom_small3.jpg" width="375" height="20"></td> <td colspan="3"><p><img src=" images/inner_box_bottom_small3.jpg" width="375" height="20"></p></td> </tr> </table> <!-- --> <font face='verdana' size='1'> <b>Note:If you see a bar chart, please refresh the current page or open up a new window. </b> </font> </td> <td rowspan="6" valign="top" background="images/box_middle_right.jpg" width="16" height=100%> </td> </tr> <!-- <tr> <td> </td> <td colspan="2" align="center"> <font> <b>Note:If you see a bar chart, please refresh the current page or open up a new window </b> </font> </td> </tr> --> <tr> <td colspan="3" align="center"><img src=" images/box_bottom.jpg" width="780" height="19"></td> </tr> </table> </td> </tr> <tr> <td height="38" colspan="3" align="center"><table width="750" border="0" cellpadding="0" cellspacing="0"> <tr> <td width="309" height="0"> </td> <td width="118" height="0" align="center"> <IMG SRC=' images/count0.gif'><IMG SRC=' images/count0.gif'><IMG SRC=' images/count0.gif'><IMG SRC=' images/count0.gif'><IMG SRC=' images/count4.gif'><IMG SRC=' images/count3.gif'><IMG SRC=' images/count5.gif'><IMG SRC=' images/count8.gif'><IMG SRC=' images/count8.gif'></td> <td width="309" height="0"> <font face='verdana' size='1'> Visitors Since July 2009</font> </td> </tr> </table></td> <td> </td> </tr> <tr> <td> </td> <td align="right" valign="top"><img src=" images/bar_coner_left_bottom.jpg" width="14" height="15"></td> <td height="0" colspan="4"><img src=" images/bar_footer.jpg" width="800" height="15"> </td> <td valign="top" align="top"><img src=" images/bar_coner.jpg" width="14" height="15"></td> </tr> <tr> <td colspan="9" align="center" valign="middle"> </td> </tr> </table> <!-- <table> <tr> <td height="20" width=100% bgcolor="edf0ed" align="center"> <span class="style1"> <FONT FACE=verdana size ="1">Copyright © 2002-2010 <a href=" http://www.noaca.org/">NOACA</a>. All Rights Reserved </font> </span> </td> </tr> </table> --> </body> </html>
--
Norm Roulet
ICEarth - realNEO - real coop
norm [at] realneo [dot] us
216-688-5221
--
Norm Roulet
ICEarth - realNEO - real coop
norm [at] realneo [dot] us
216-688-5221
--
Matthew/Mattie Reitman
Beyond Coal Field Organizer, Ohio
Sierra Club, 131 N High St #605, Columbus OH 43215
mattie [dot] reitman [at] sierraclub [dot] org
614.461.0734 x316 (o) / 315.450.6628 (c)
--
Norm Roulet
ICEarth - realNEO - real coop
norm [at] realneo [dot] us
216-688-5221
|


THIS IS
The Political Gangster
Norm man this is deep! Way to go Roulet.
Who is the CTO of America?
This guy?
http://venturebeat.com/2009/04/17/chopra-named-obama-cto-white-house-tech-plans-coming-together/
Your work on the EPA's use of false science and technology hocus-pocus when it comes to air quality should get national attention. I do believe in your work, Norm. And, I support your efforts to bring transparency to government. Sadly, I think this CTO guy may just look the part...just like Anthony Ma. I hope I am wrong. I am so tired of trying to believe in any one.
worse than EPA false science and technology hocus-pocus
worse than EPA false science and technology hocus-pocus... intentional poisoning of 1,000,000s of citizens.
I saw Chopra speak at the city club - I asked in advance for an interview after the event but the OneCommunity shitheads had set up a private session for Chorpa to schmooze with all the Tony Mas AND WORSE in town - this town has the lowest bunch of sellouts for tech leadership you may imagine - I was only able to briefly speak with Chopra and get his card before the great and powerful Mark Ansbury yanked Chopra away into private session - if Ansbury could have grabbed the card out of my hand he would have.
Thanks to the City Club staff for trying to arrange a legitimate interview screwed over by ONECOMMUNITY shitheads.... City Club of Cleveland staff rock!
Regarding Chopra - he is smart and understands the future of IT and has some grasp of open source... his only problem is when he comes to places like Cleveland he is detained by shitheads like at OneCommunity and prevented from talking to legitimate information technology experts like myself' about our real community challenges.
He is too busy when he travels places like Cleveland getting begged for federal funds to bailout crap like the OneCommunity network
I took care of that problem personally... I only get fucked once by this OneCommunity, boys!
Disrupt IT
BTW - you'll get an expert assessment of Chopra
BTW - you'll get an expert assessment of Chopra as I see him deal with our EPA technology issues
Disrupt IT